Connect
to all disparate data sources regardless of type or location
petrovisor apps
Allows for real-time improvement of production and injection networks with the aim of boosting asset performance while maximizing economic success rates.
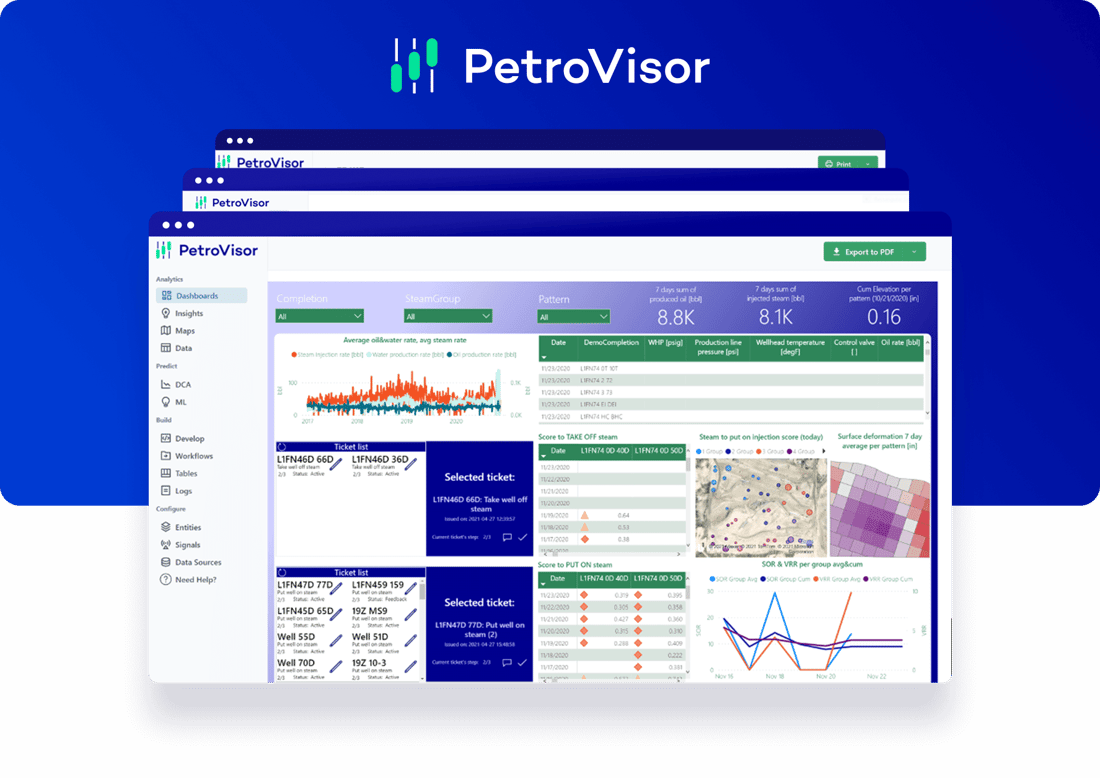
PetroVisor provides a digital cortex that increases profitability by lowering operational risks and expenses. The platform can incorporate both subsurface and surface-related components, such as well and reservoir restrictions. Waterflooding and enhanced oil recovery activities are being augmented by digital technologies that monitor, surveil, and optimize operational and technical choices to achieve production and injection objectives while also increasing field recovery and economic advantages.

to all disparate data sources regardless of type or location
all related data in a single, unified data layer for consistent answers
data and analytics in real-time with machine learning
Lower lifting costs by 10 - 20% through advanced problem detection and lift optimization using AI and machine learning.
A good place to start in understanding machine learning is understanding what it is used to accomplish. Machine learning can have a lot of different applications, but at its most basic it is a tool used to find patterns in large sets of data and predict outcomes. These data can be measurements of anything—well data or financials, for example.
To function correctly, EOR techniques need continual attention and optimization, which is made more difficult by the changing state of the field and individual well circumstances. PetroVisor secures the solution to this problem by utilizing data analytics and automated solutions to perform the necessary computations and visualize the output, resulting in a foundation for quick decision-making and improved field & well performance in order to meet the desired production targets.
PetroVisor enables for the simultaneous monitoring, surveillance, and optimization of numerous entities such as reservoirs, wells (producers and injectors), equipment, or any user-defined entity that may be combined with a built-in alert system depending on production/injection performance. The automated solutions may operate in tandem, allowing for real-time operational, engineering, and asset choices.
Full integration of surface and subsurface-related components with any chosen time increments enables the implementation of reservoir models, scheduling rules, and field and/or well dependant restrictions. The app can save time and effort by developing and protecting a standardized data set that includes the connectivity of numerous independent sources and a decision platform.
In addition to improved decision-making, the app allows for well, pattern, and reservoir analysis. The results of the study may be saved and used to help engineers focus on and identify low-performing wells, trends, or reservoirs that may require countermeasures, allowing for ongoing improvement throughout the whole field.
©2022 Datagration Solutions, Inc. Privacy Policy Website Terms of Use