![EV_ LDAR Dashboard](https://www.datagration.com/hs-fs/hubfs/EV_%20LDAR%20Dashboard.png?width=1900&height=1574&name=EV_%20LDAR%20Dashboard.png)
See LDAR in Action: Take-A-Tour
![Asset 116](https://www.datagration.com/hs-fs/hubfs/Asset%20116.png?width=400&height=400&name=Asset%20116.png)
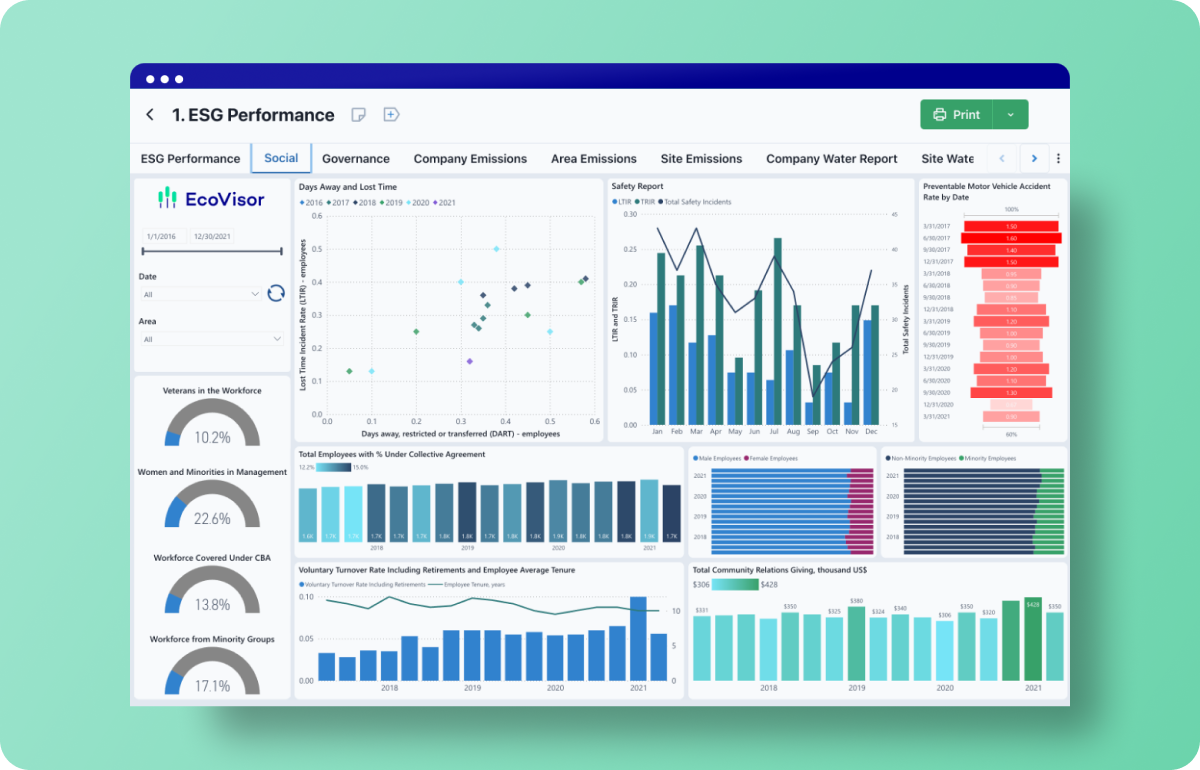
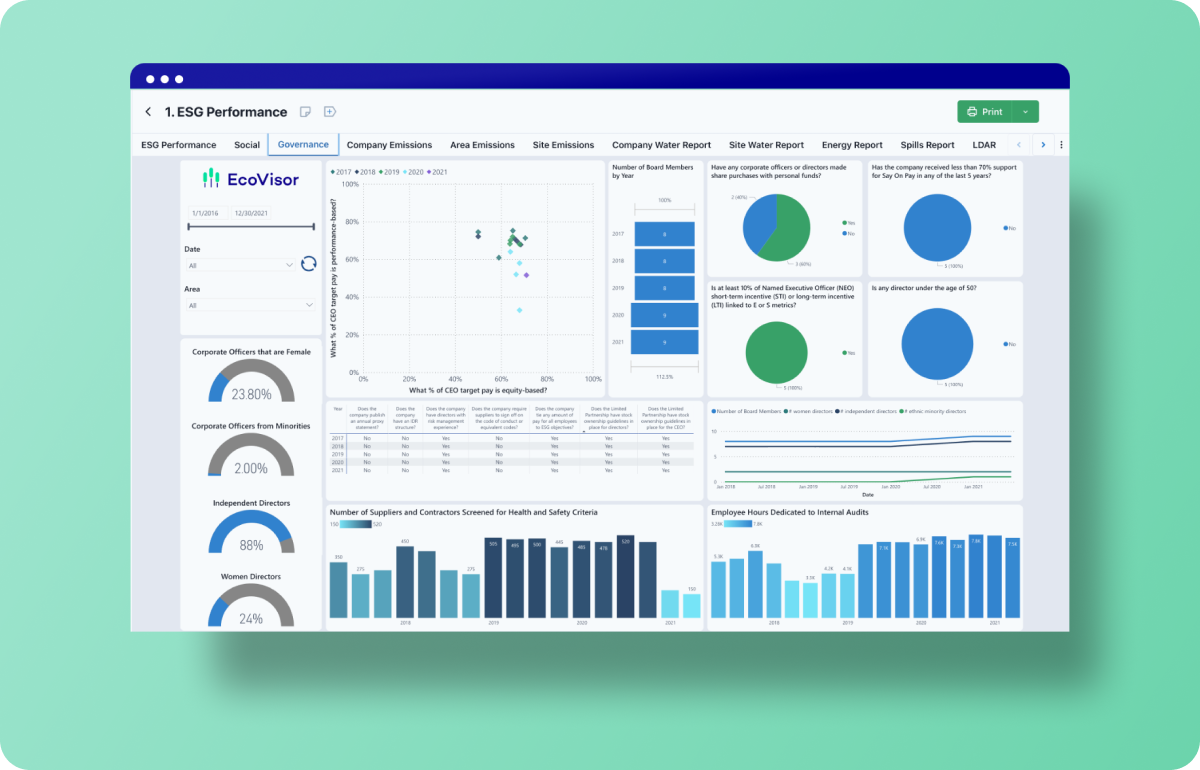
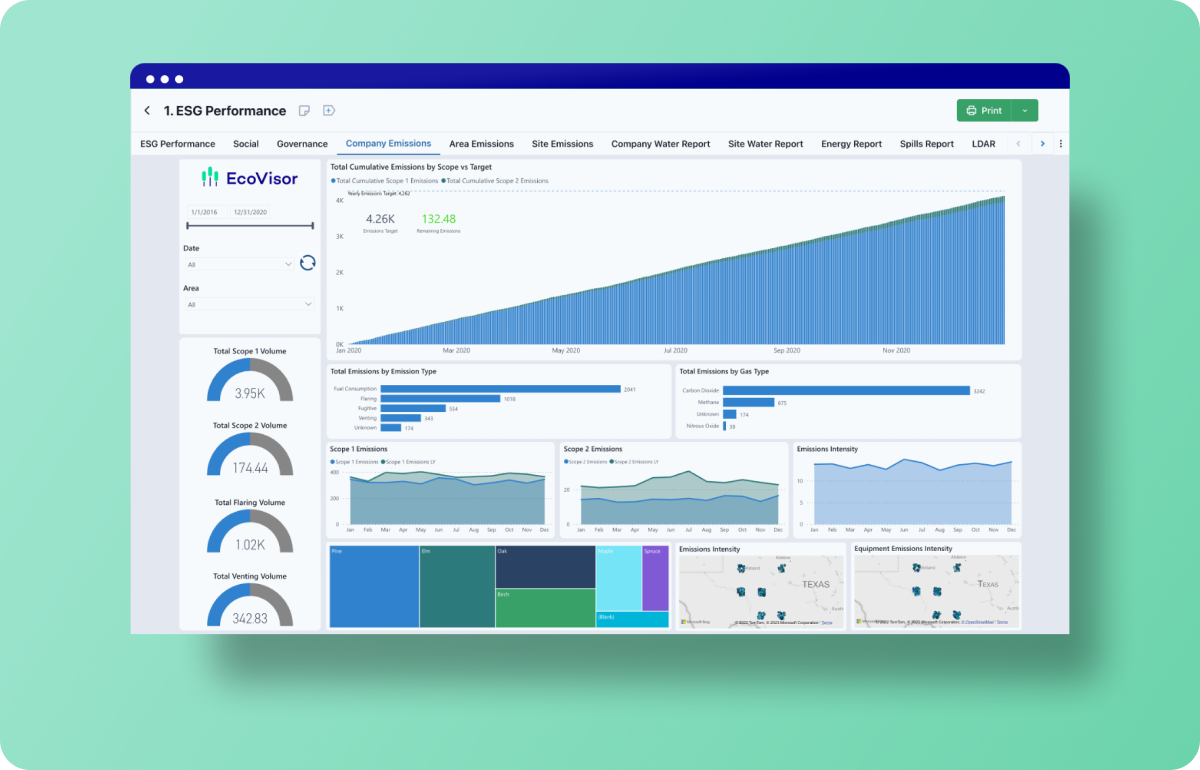
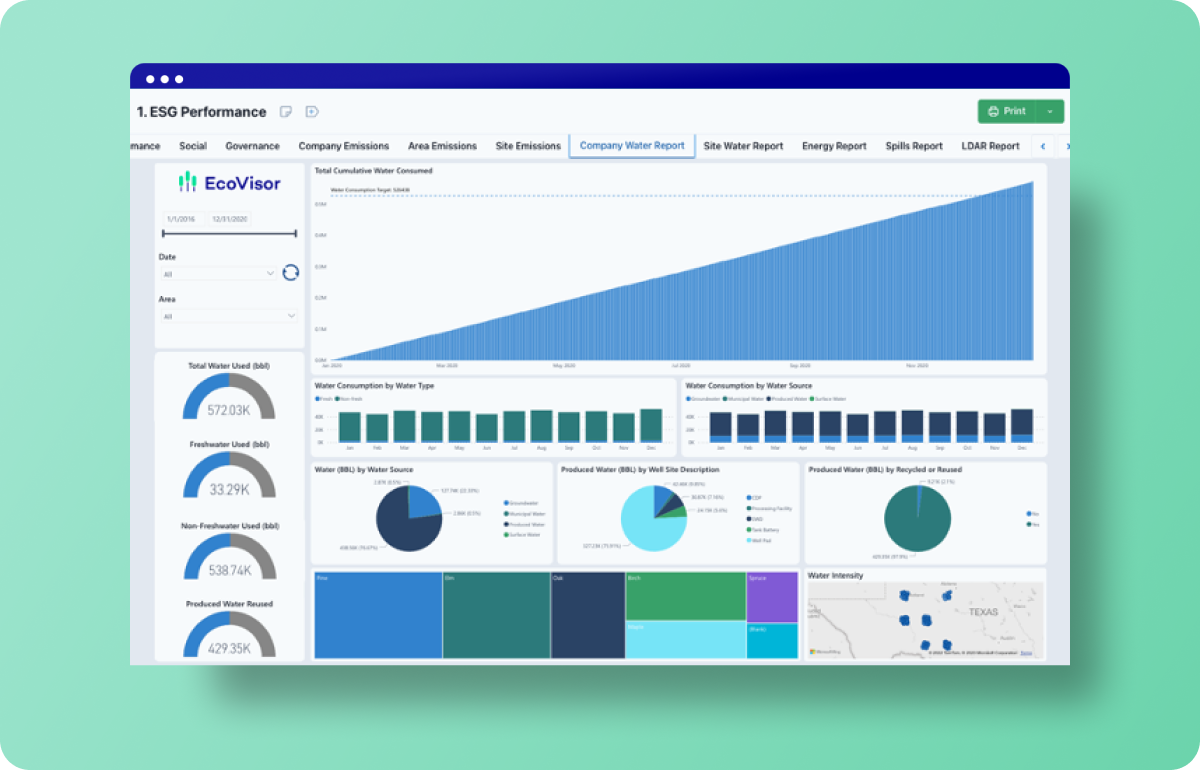
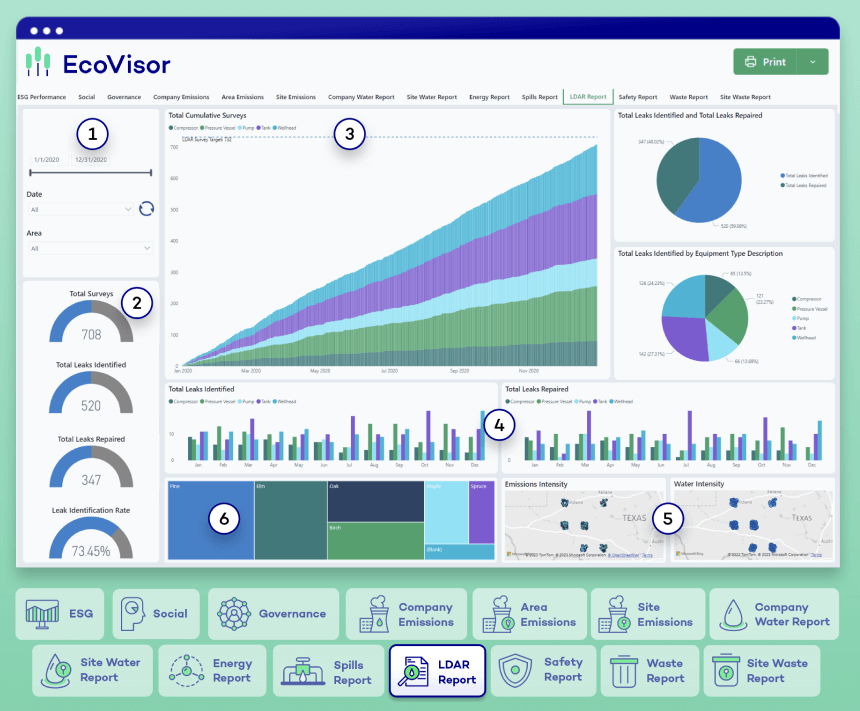
Adjust dashboard data to specific date ranges and/or areas.
![Asset 124](https://www.datagration.com/hs-fs/hubfs/Asset%20124.png?width=400&height=400&name=Asset%20124.png)
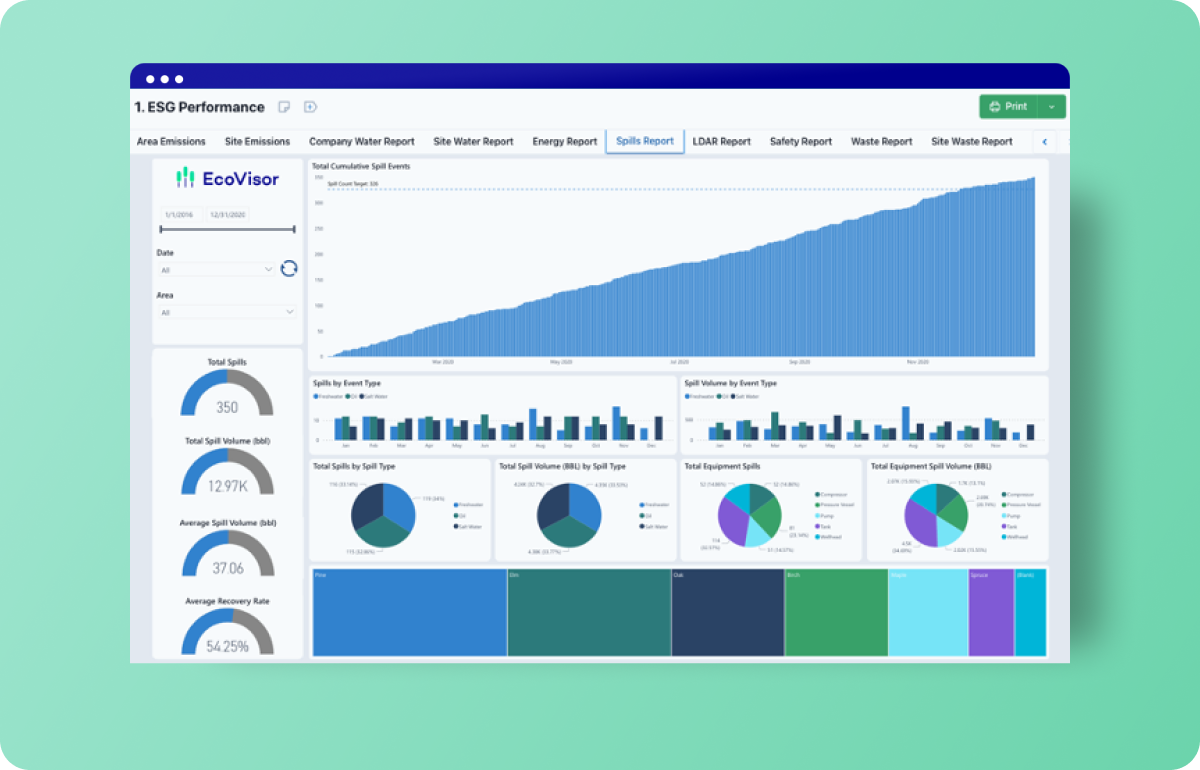
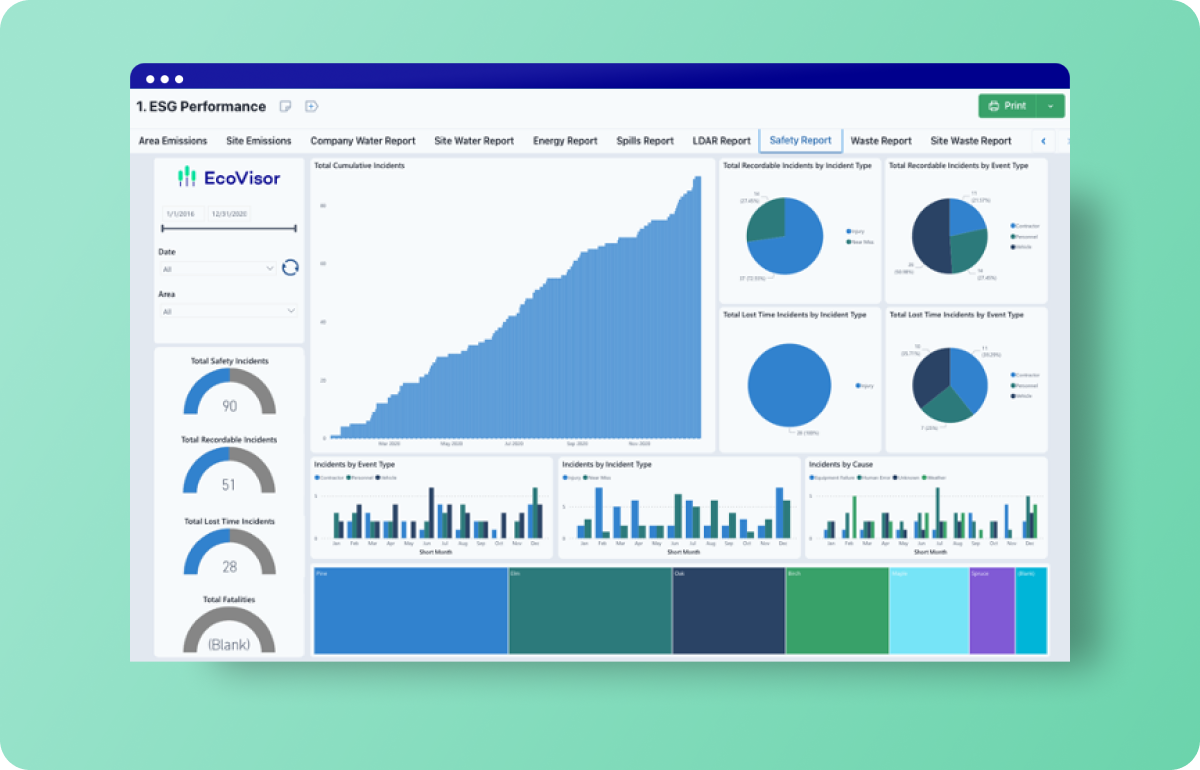
View key performance indicators comparing survey count with total leaks identified and repaired.
![Asset 123](https://www.datagration.com/hs-fs/hubfs/Asset%20123.png?width=400&height=400&name=Asset%20123.png)
Track survey execution and type over time.
![Asset 122](https://www.datagration.com/hs-fs/hubfs/Asset%20122.png?width=400&height=400&name=Asset%20122.png)
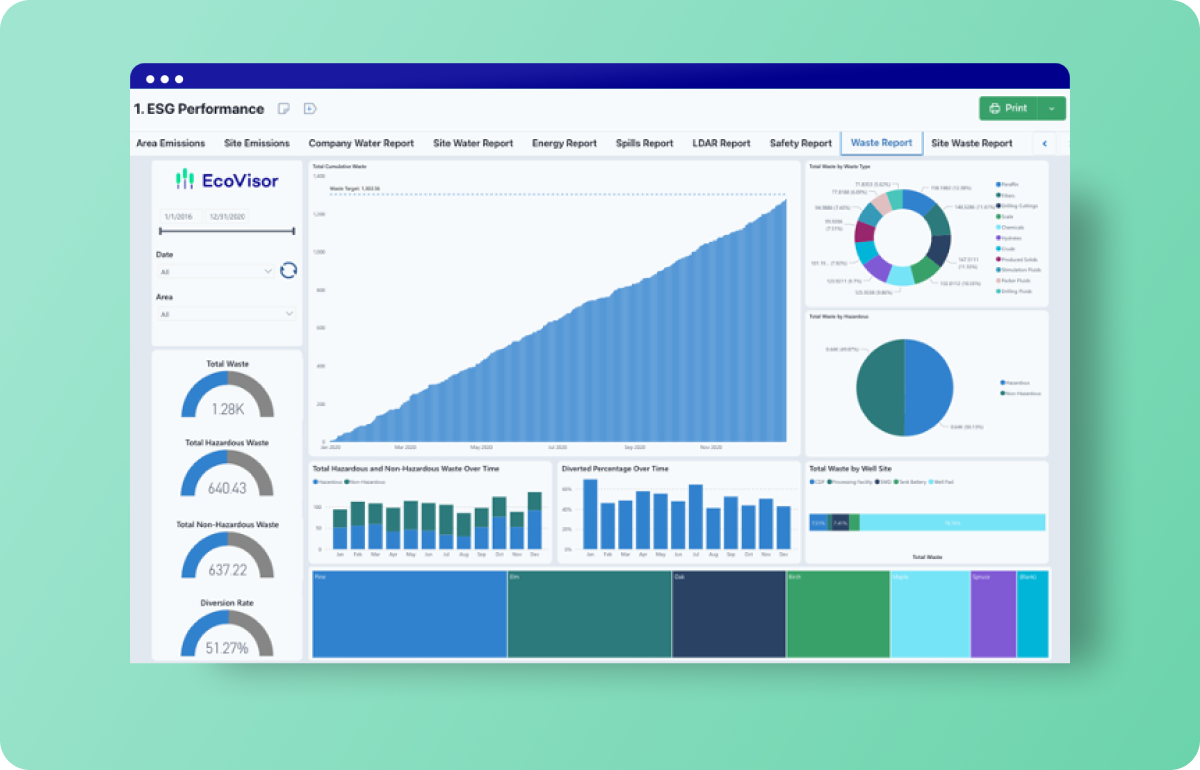
Drill down into LDAR data to understand leaks identified and repaired by equipment type.
![Asset 121](https://www.datagration.com/hs-fs/hubfs/Asset%20121.png?width=400&height=400&name=Asset%20121.png)
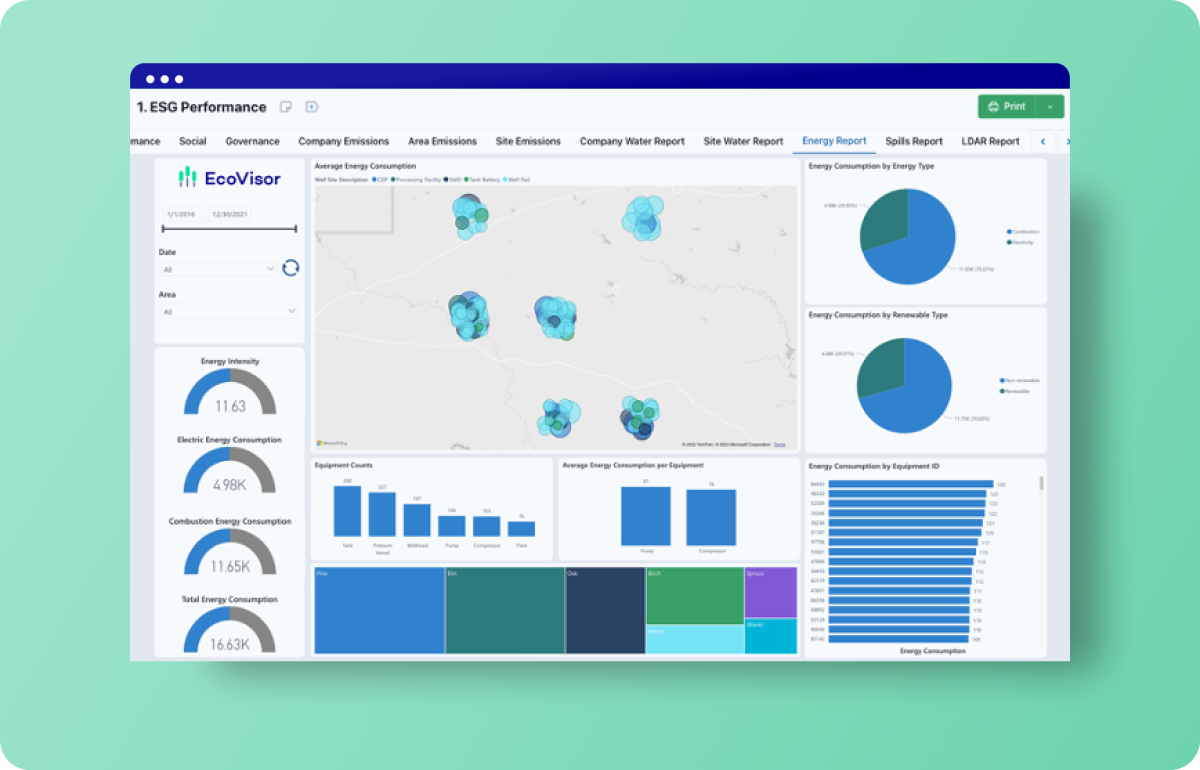
Map LDAR data with emissions and water intensity data.
![Asset 120](https://www.datagration.com/hs-fs/hubfs/Asset%20120.png?width=400&height=400&name=Asset%20120.png)
Filter data by asset area.