Reservoir KPIs
When geologic data is available, calculate numerous reservoir-based Key Performance Indicators including landing zone percentile, net pay, porosity, porosity-thickness, etc.
petrovisor apps
Improve asset decision-making, boosting capital and investment efficiency with a clear technical and economic framework.

When geologic data is available, calculate numerous reservoir-based Key Performance Indicators including landing zone percentile, net pay, porosity, porosity-thickness, etc.
Calculate numerous production-based Key Performance Indicators including IP90, IP365, production-based primary phase determination, recent secondary phase yields, etc.
Forecast 40-year individual-well monthly production for all producing phases on all wells with a multi-pass, rule & regression-based workflow. Utilize the 3-parameter hyperbolic equation (Arp’s) with an exponential tail with numerous user-defined guides that can be area and formation-dependent. Includes gap, rework, and outlier detection and handling. Forecasts are easily edited in a dynamic interactive editing window which also allows additional decline segments to be imposed.

Use ML and/or MVR to predict production at drilling or rework locations from completion and reservoir data. Typically, the ML/MVR models are trained to predict IP90 and EUR for a specific completion design and geologic location, and those predictions are converted into 40-yr monthly production forecasts by modifying local zero-time average production curves from existing nearby and/or analogous wells.

Standard individual well, 40-yr, monthly cash flow analysis. All producing phases, NGL purity product streams, fixed and variable operating costs, abandonments costs, existing and drilling/rework locations, etc. When available, utilize internal accounting system data for operating and well costs. Roll up to any hierarchy level for multi-well cash flows.

Development and A&D investor returns with sensitivities to the acquisition price, commodity prices, production, capital costs, and operating costs. Impose numerous asset & corporate-level cash flows on the multi-well roll-ups including: debt, equity, dividends, working capital, infrastructure capital, plant, and pipe take or pay obligations and ARO’s.
Create non-overlapping closed polygons around each well encompassing the acreage closest to that well and any offsets. This process generates a first pass estimate of drainage areas, lateral/well spacings at the time the well began to produce, lateral/well spacing as of today, and a great mapping feature that can be color-filled with any signal in PetroVisor.

to all disparate data sources regardless of type or location
all related data in a single, unified data layer for consistent answers
data and analytics in real-time with machine learning
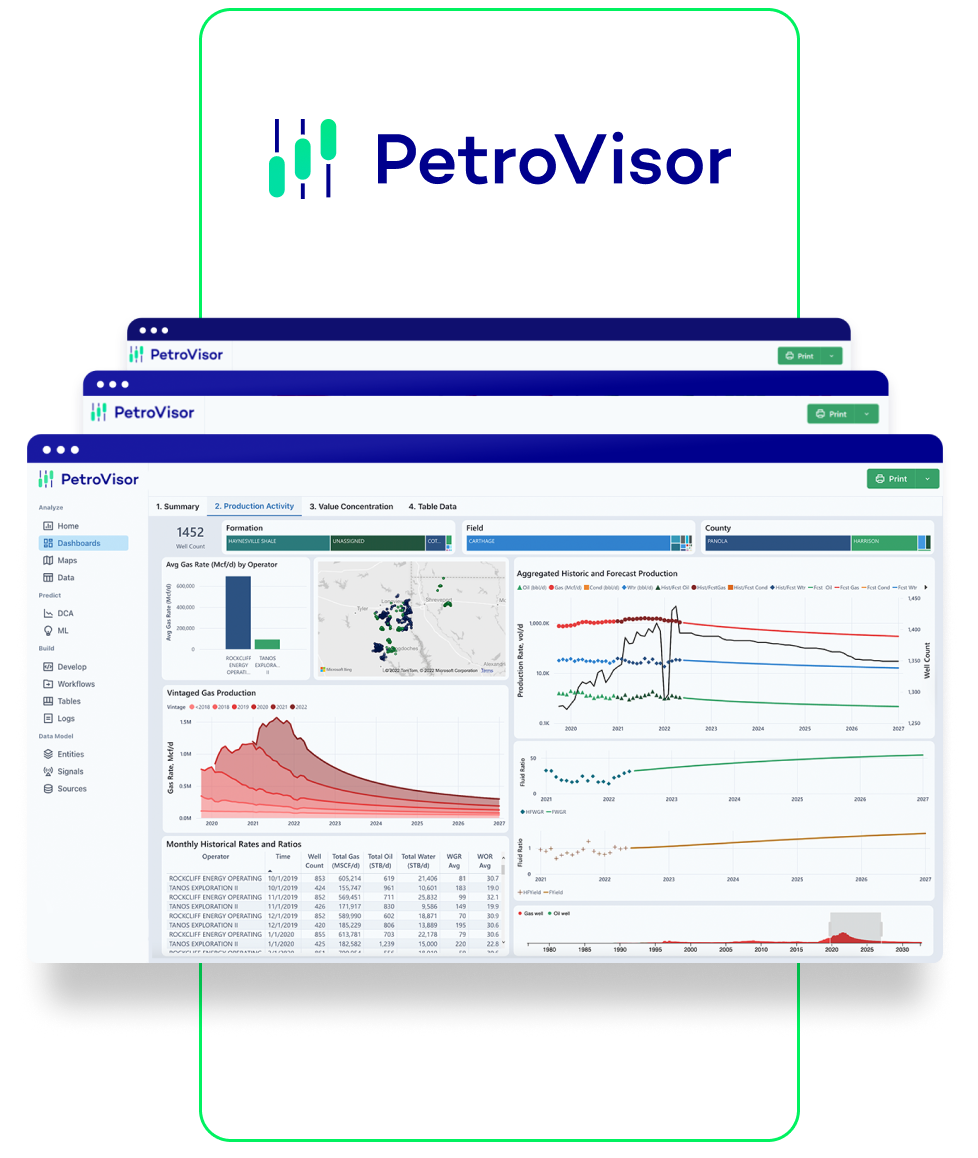
Development planning and A&D analysis are difficult jobs that require collaboration across several skill sets. When changing commodity prices, uncertainties in capital costs, operating costs, production forecasts, and developing technologies are factored in, the process becomes nearly impossible; companies frequently sacrifice technical quality in order to provide findings in timeframes relevant to decision-makers.
PetroVisor's Development and Acquisitions & Divestitures App addresses this issue. This app, which is native to the PetroVisor Platform, produces high-quality results at record speed. We integrate data analytics, engineering, economics, uncertainty analysis, and machine learning in tried-and-true procedures that allow engineers and geologists to use their time wisely, focusing on analysis and conclusions worthy of their expertise rather than moving data and generating graphs.
Quickly optimize drilling and rework schedules to achieve corporate production and financial goals and accurately understand cash flows, valuations, outside funding needs, realistic dividend projections, and investor returns. Prepare development strategies, budgeted cash flows, and conclude A&D decisions with confidence.
Improve capital efficiency with an easy-to-understand and explain capital program or A&D decision. Quantitatively address and illustrate the impact on debt, equity, and dividends from uncertainty in production forecasts, capital costs, operating costs, and commodity prices.
Quantify and illustrate the impact on investor returns from uncertainty in production forecasts, capital costs, operating costs, and commodity prices.
Quantify how cost overruns and missed field activity deadlines impact corporate goals and financial success.
Datagration presented the PetroVisor™ Platform at the Energy Tech Night in June 2021.
©2022 Datagration Solutions, Inc. Privacy Policy Website Terms of Use