Production KPIs
Calculate numerous production-based Key Performance Indicators including IP-90, IP-365, production-based primary phase determination, recent secondary phase yields, etc.
petrovisor apps
Track asset or firm performance against budget and AFEs, combine the most recent accounting, budget, operational, reserves, and ESG data with engineering and economics.

Calculate numerous production-based Key Performance Indicators including IP-90, IP-365, production-based primary phase determination, recent secondary phase yields, etc.

Forecast 40-year individual-well monthly production for all producing phases on all wells with a multi-pass, rule & regression-based workflow. Utilize the 3-parameter hyperbolic equation (Arp’s) with an exponential tail with numerous user-defined guides that can be area and formation dependent. Includes gap, rework and outlier detection and handling. Forecasts are easily edited in a dynamic interactive editing window which also allows additional decline segments to be imposed.

Use ML and SCADA to track well performance vs expectations, notifying operational staff when wells begin to experience production issues.

Standard individual well, 40-yr, monthly cash flow analysis. All producing phases, NGL purity product streams, fixed and variable operating costs, abandonments costs, existing and drilling/rework locations, etc. Utilize internal accounting system data for operating and well costs. Roll up to any hierarchy level for multi-well cash flows.
Michael Stundner and David Gonczi shared their experiences with Datagration and discussed the financial gain resulting from production automation and digitalization.

to all disparate data sources regardless of type or location
all related data in a single, unified data layer for consistent answers
data and analytics in real-time with machine learning

Due to dispersed data structures and various analysis software, it is extremely difficult to keep executives and operational employees up to date on the most recent data. Comparing actual performance to budget is always a priority for the Executive, but it is time-consuming and not updated regularly. When the lease running expenses are locked-in an accounting system that is not field-staff friendly, it is difficult for the operations staff to properly control costs and optimize operating profits.
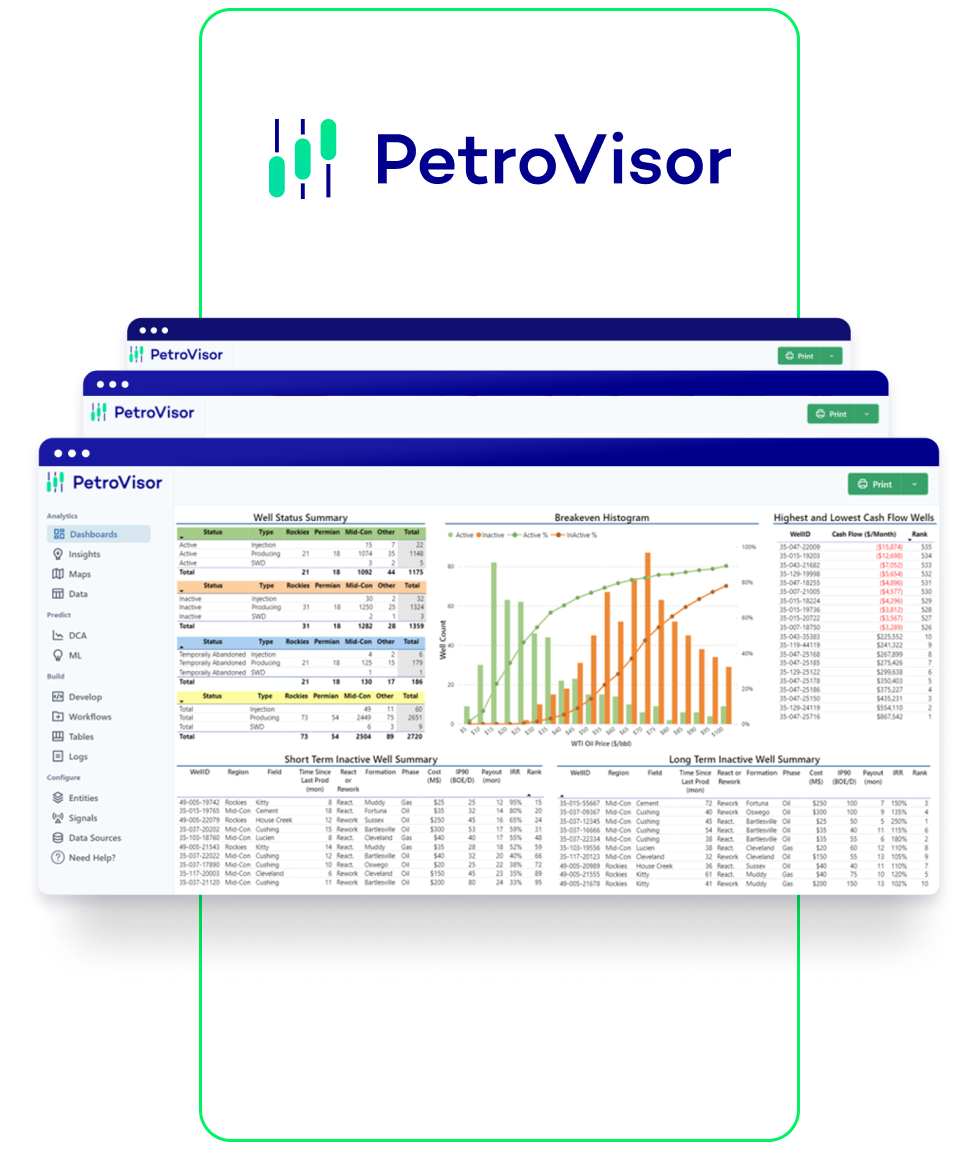
PetroVisor tackles this challenge by automatically importing and integrating financial, budget, operational, reserves, and ESG data with engineering and economics and then displays the findings on executive and field-friendly dashboards. The update frequency is determined by automation, and no human intervention is necessary to produce the dashboards. This module provides the entire organization, from the CEO to the pumper, with up-to-date and automatic data awareness.
Up-to-date awareness of company performance vs. budget and AFE’s allows the executive to react quickly to any emerging problems and interact with their board and investors with conviction and confidence. This same up to date awareness at the field-level allows better cost control, increased uptime, and empowers field personal to take an active and rewarding role in improving company profitability.
Place information at the fingertips of pumpers and foreman to better control costs and increase uptime. Direct field staff each day to target the highest impact activities through ML-based notifications of wells experiencing production problems.
Know, don’t guess, how the company and individual assets are performing compared to expectations. React to problems as they develop, not after they have unknowingly festered.
©2022 Datagration Solutions, Inc. Privacy Policy Website Terms of Use