The Datagration Platform is designed to automate routines and subroutines to drive company performance. It's a commercial software program designed for all business aspects.
Datagration works because of it's Unified Data Model. The platform can connect to any data source and be modified to fit companies needs because of it's unique set up and ability to use the data model.
The output of the platform are dashboards that can be used by every individual in the company to get to key business decisions.
Before the dashboards are available, the platform must be connected to data, run key performance calculations and workflows and establish the connection to the dashboard.
To begin using the platform, data sources have to be established. The source data stays intact and a copy of the data comes into the data model. Simply put, connect the data.
Connect Data - Data Model
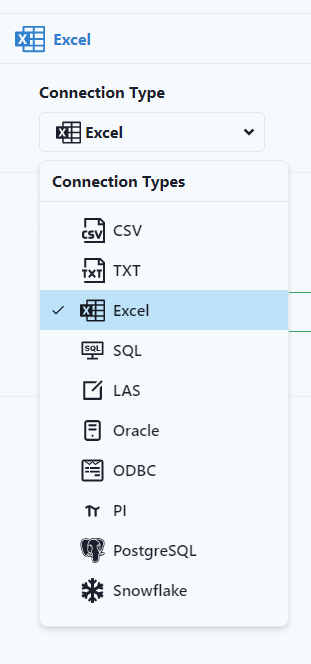
1. Connections
Data Sources are Connected, connecting to source files such as excel or SQL. Many different data sources can be connected.
2. Sources
Data Sources are mapped. They are broken down by the type of entity and period of time. These mappings are important to establish entities and signals used throughout the platform. 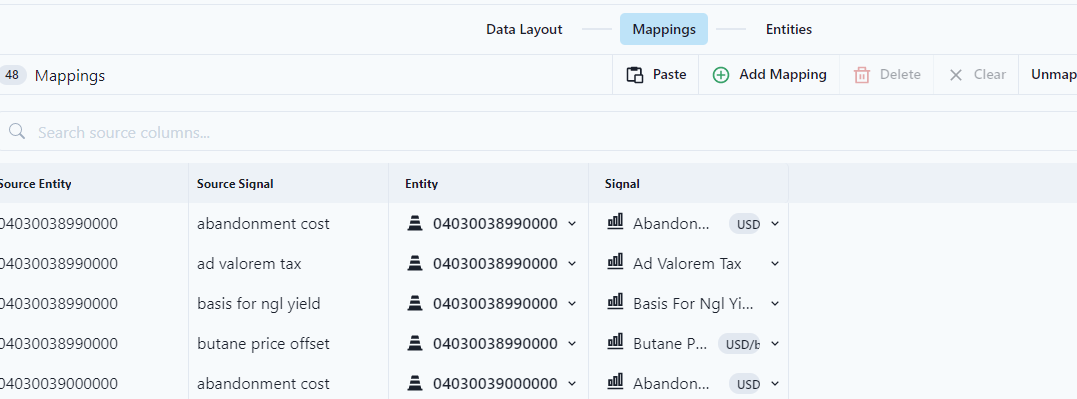
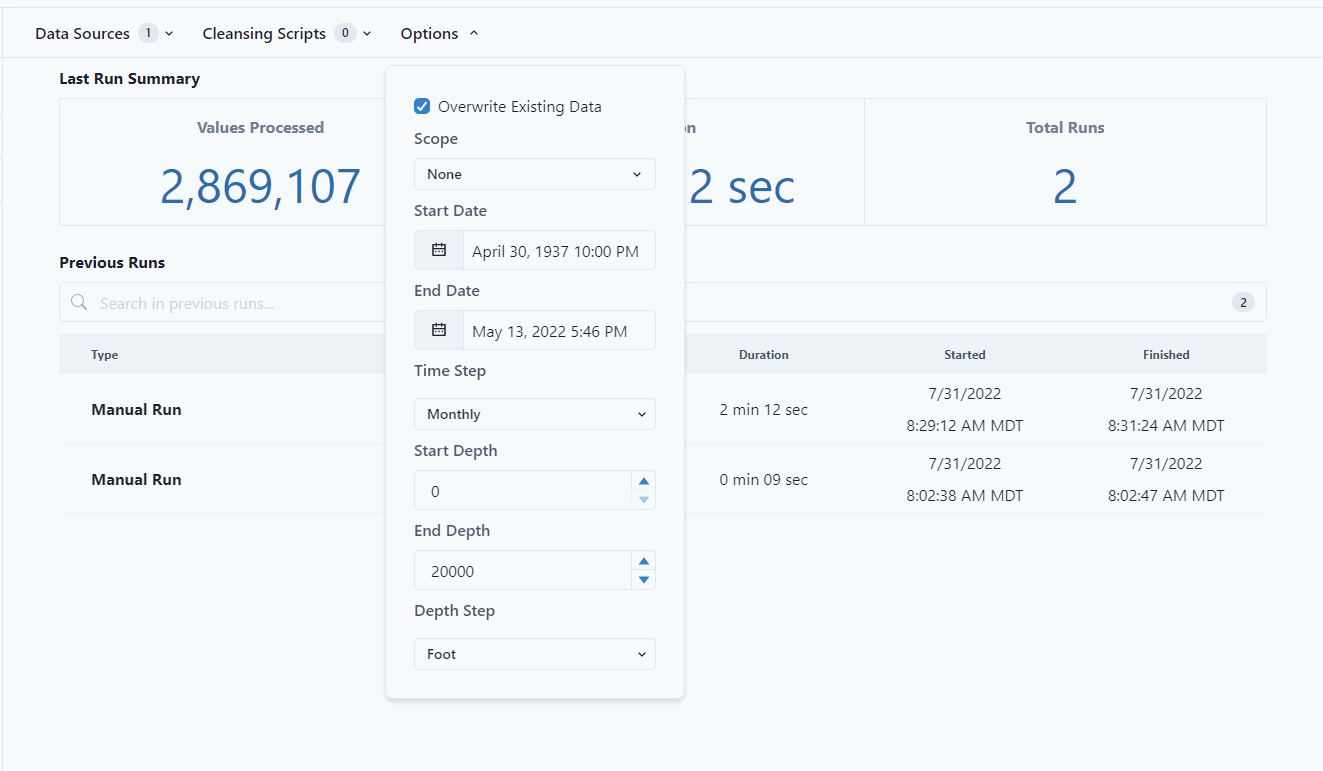
3. Data Integrations
Data Sources are then integrated to automatically update. In the integration, data cleansing can happen, such as skipping empty rows or negative values. The scope of the integration is also set, meaning if data should only be pulled during a specific time or at a specific depth.
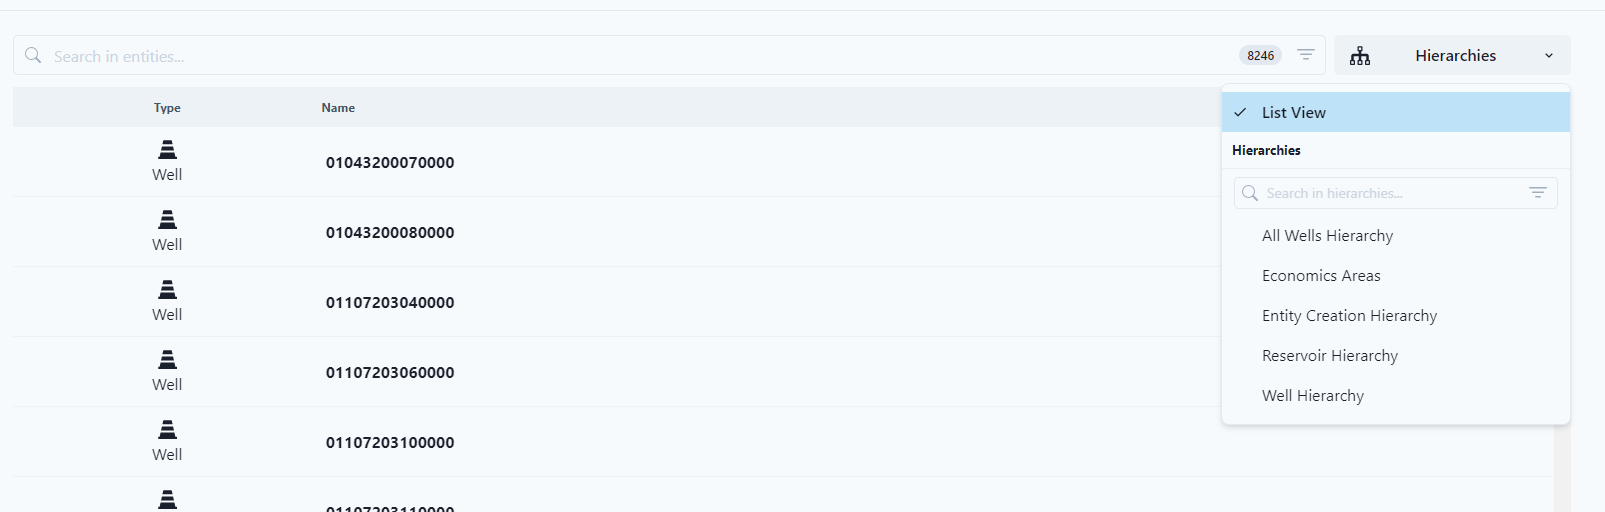
Entities and Signals
After connecting data, Entities (equipment that can measure one (1) or more signals) and Signals (specific measurable data from tied to an entity) are available to view. Entities can be viewed by hierarchy (how the entities have a natural relationship.) Multiple hierarchies can be viewed.
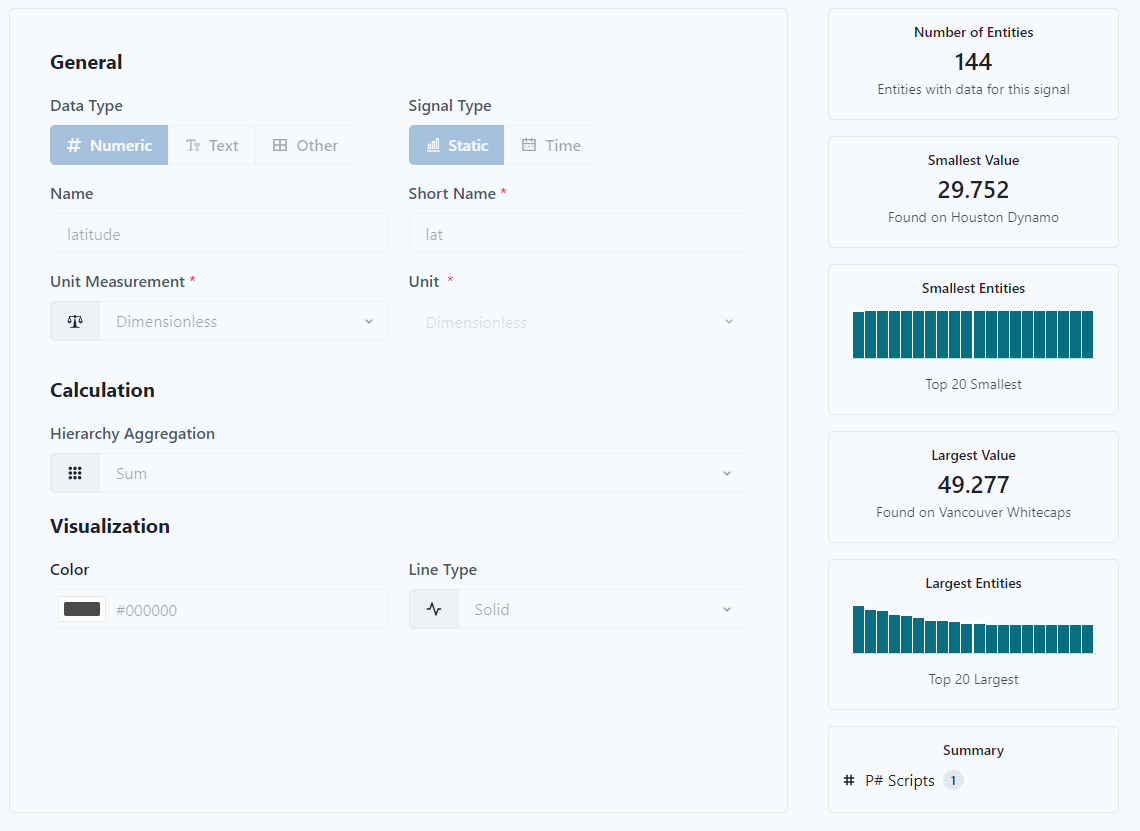
Signals can be static or dynamic record. An example would be latitude and longitude associated with an entity.
Build - Automatic Workflows
Once data is connected and has hierarchy, calculations can be run consistently.
Develop
These calculations can be brought in through established Datagration Packages or written in house. Calculations start in Develop by writing simple scripts.
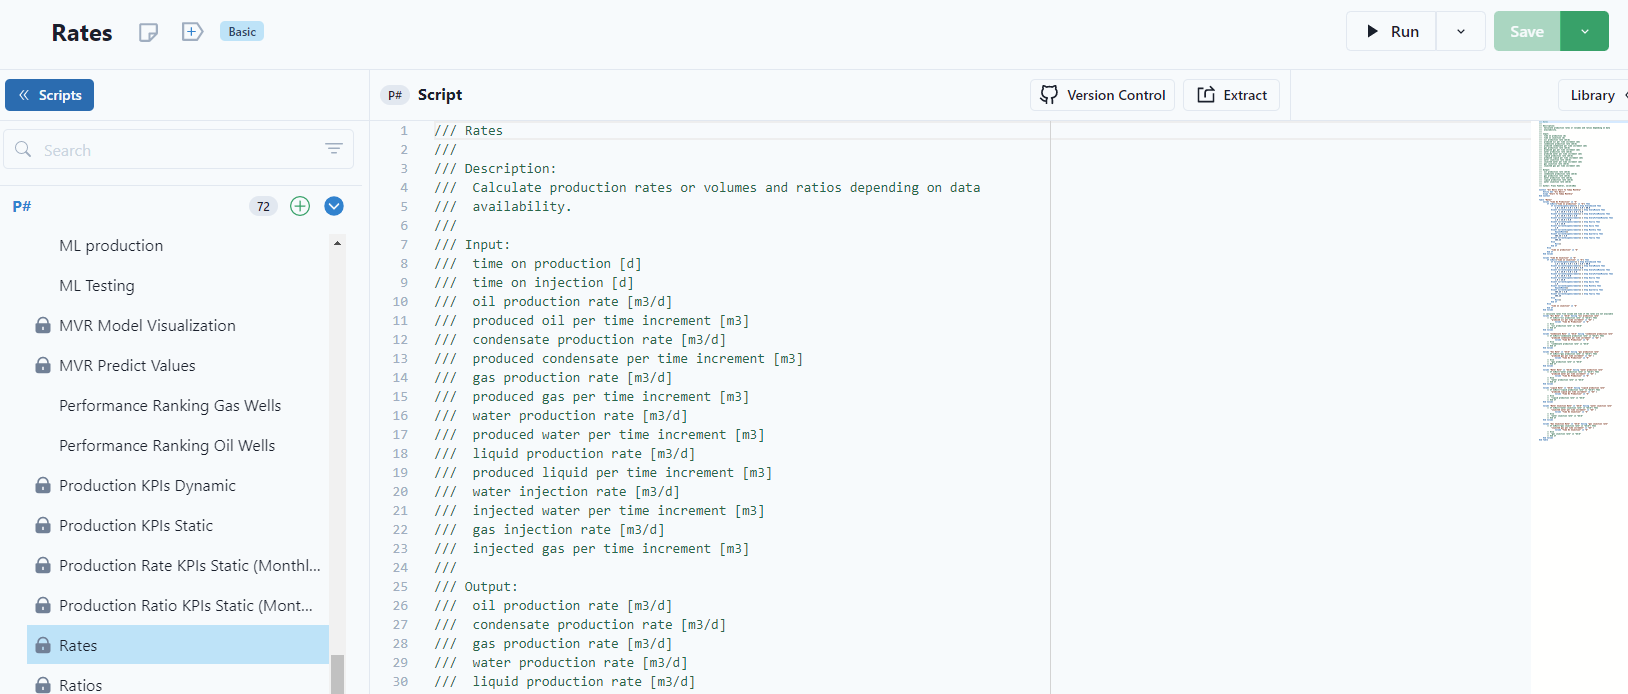
These scripts are packaged into Workflows.
Workflows
Workflow run scripts such as P# scripts, R, and ML Models. A workflow is an aggregation a simple series of calculations. It's simple blocks of code that makes the process transparent. Datagration has 100s of workflows (packages) that help bring out the outcomes (dashboards and maps) that enable customers to use their data.
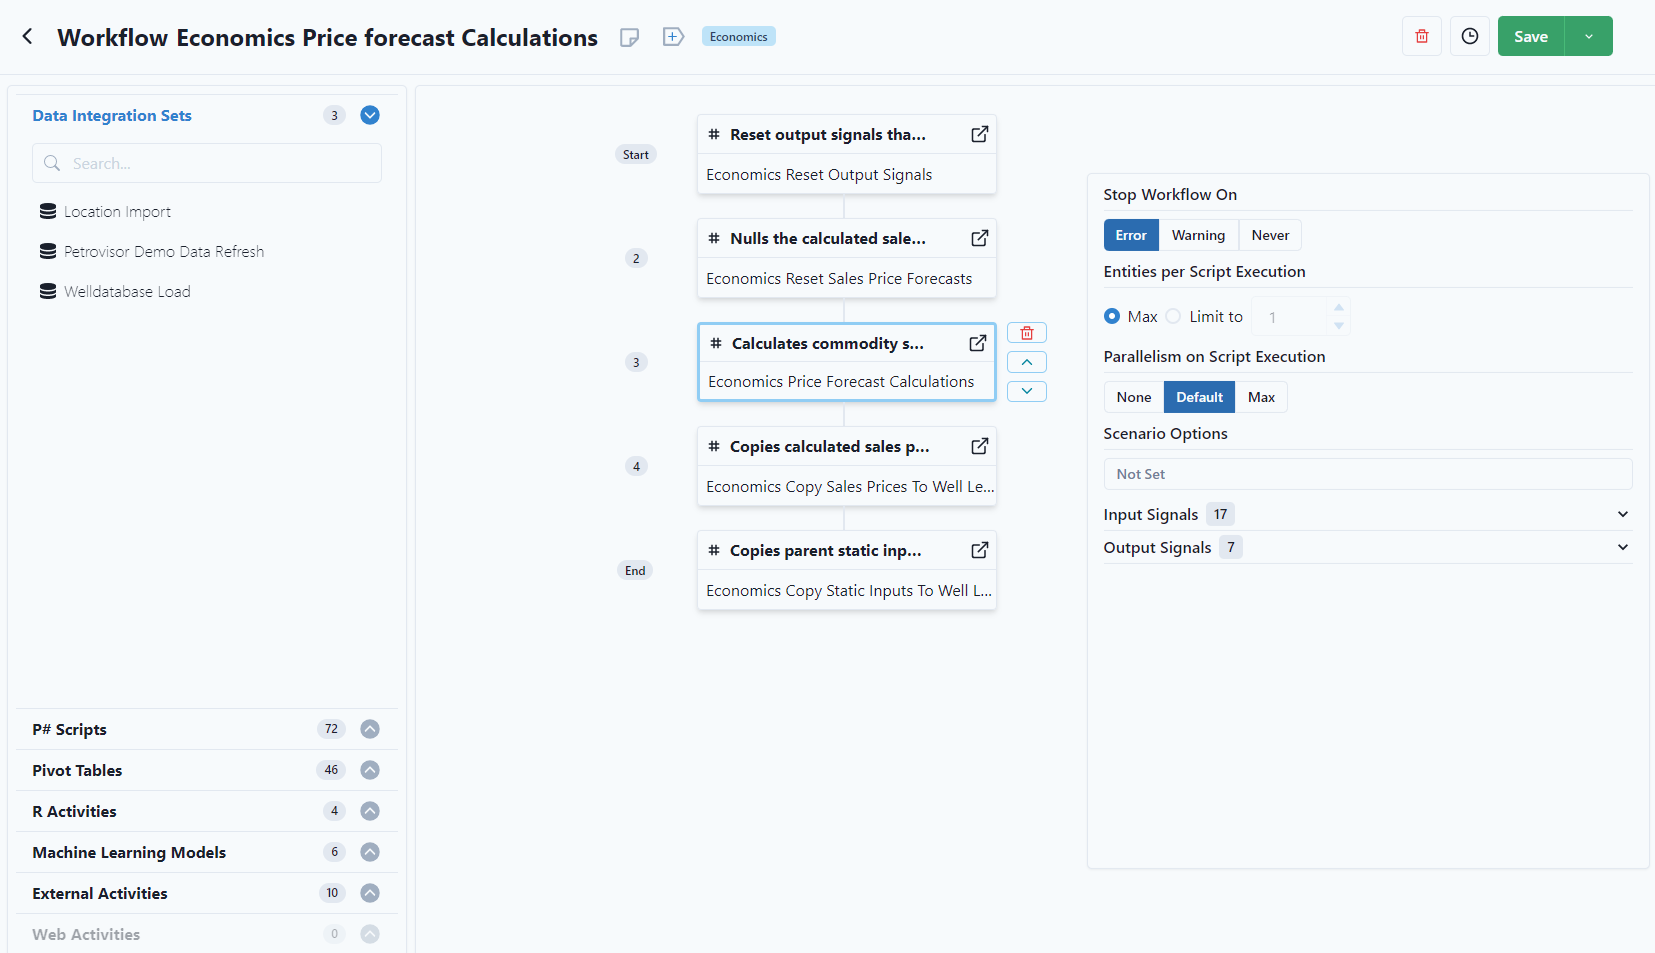
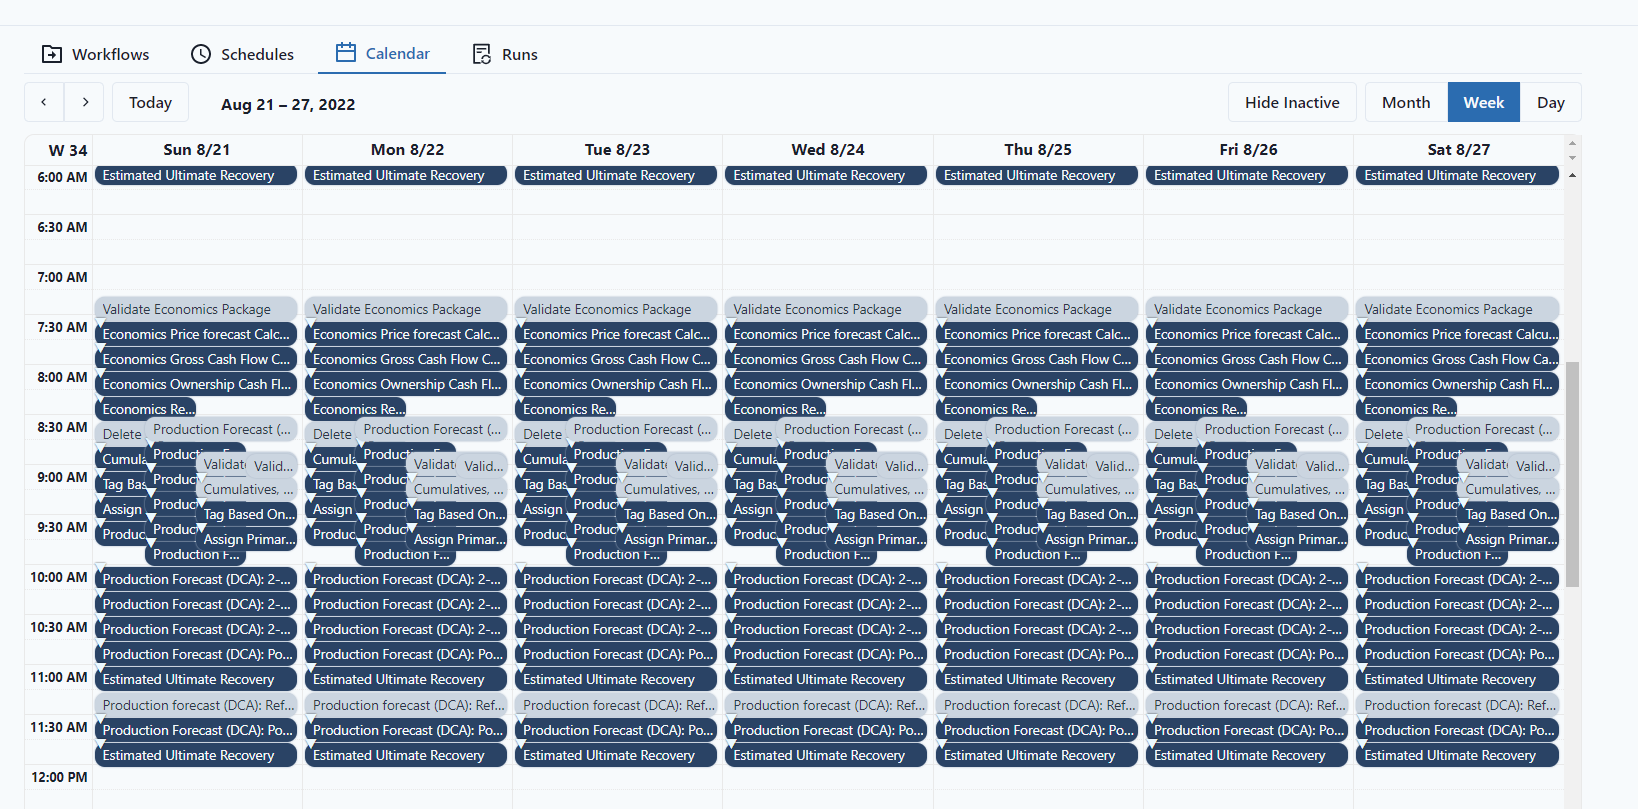
Workflows can be scheduled to run in a certain order or at a certain time of time, an example would be to pull in new data early in the morning so engineers can see new data every morning.
Tables
Certain workflows create tables that are used to create the visualization that is import in analyzing data.
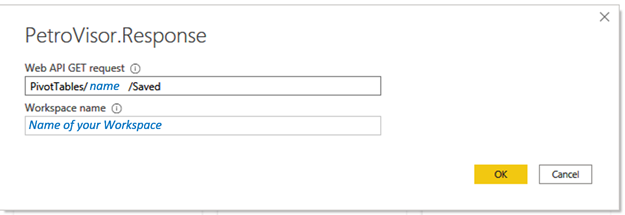
Connecting to Power BI
Datagration uses Power BI to build dashboards. Scripts, Tables, and Workflows are easily connected to display data in Datagration built Dashboards.
Analyze
After connecting and integration data, it's easy to visualize through dashboards, maps, and data. Economics, production, asset data can all be compiled systematically.
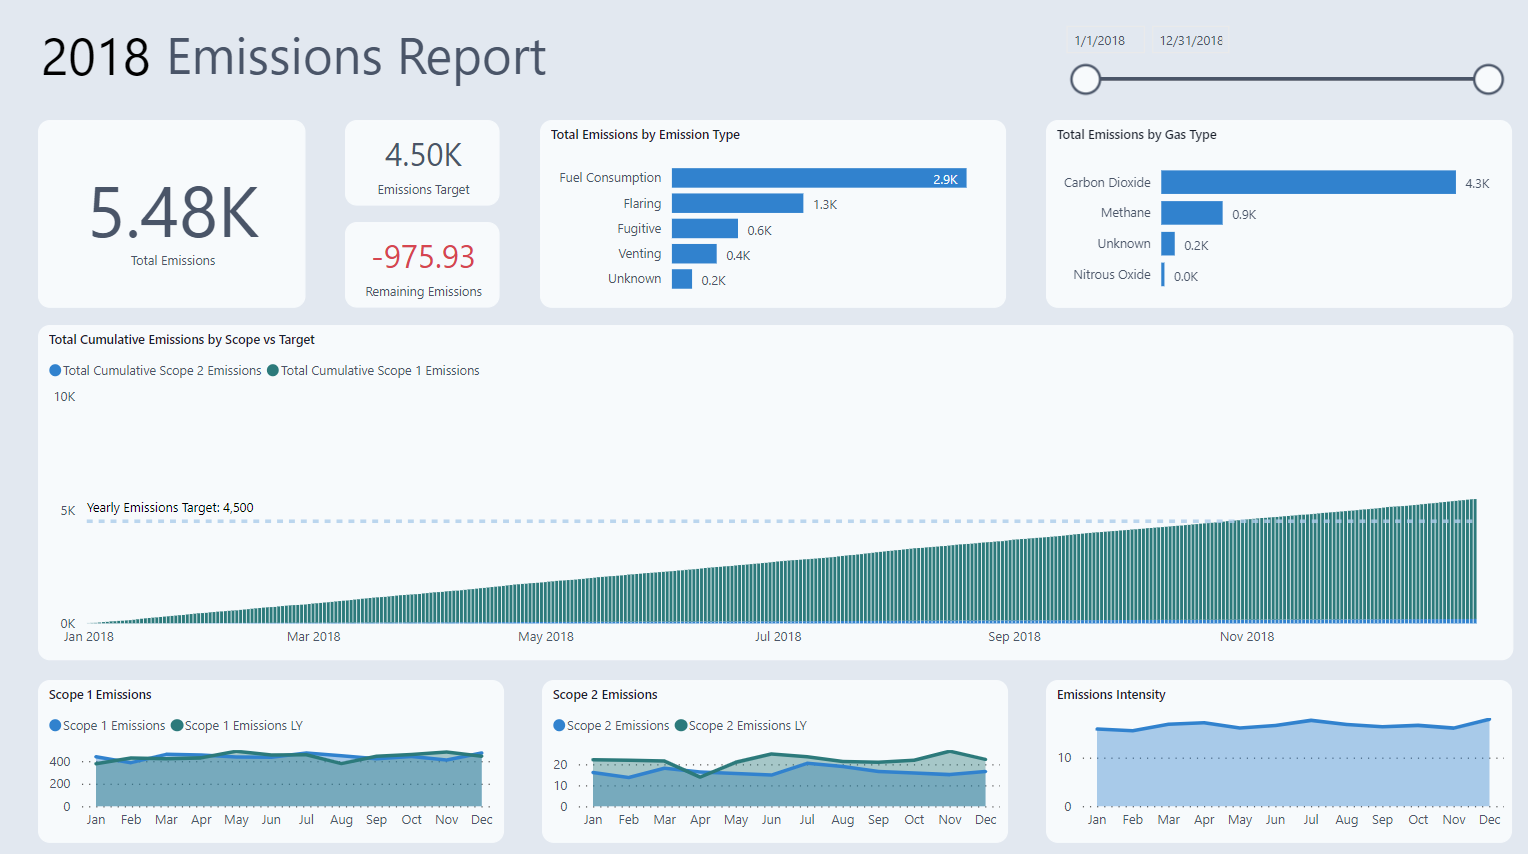
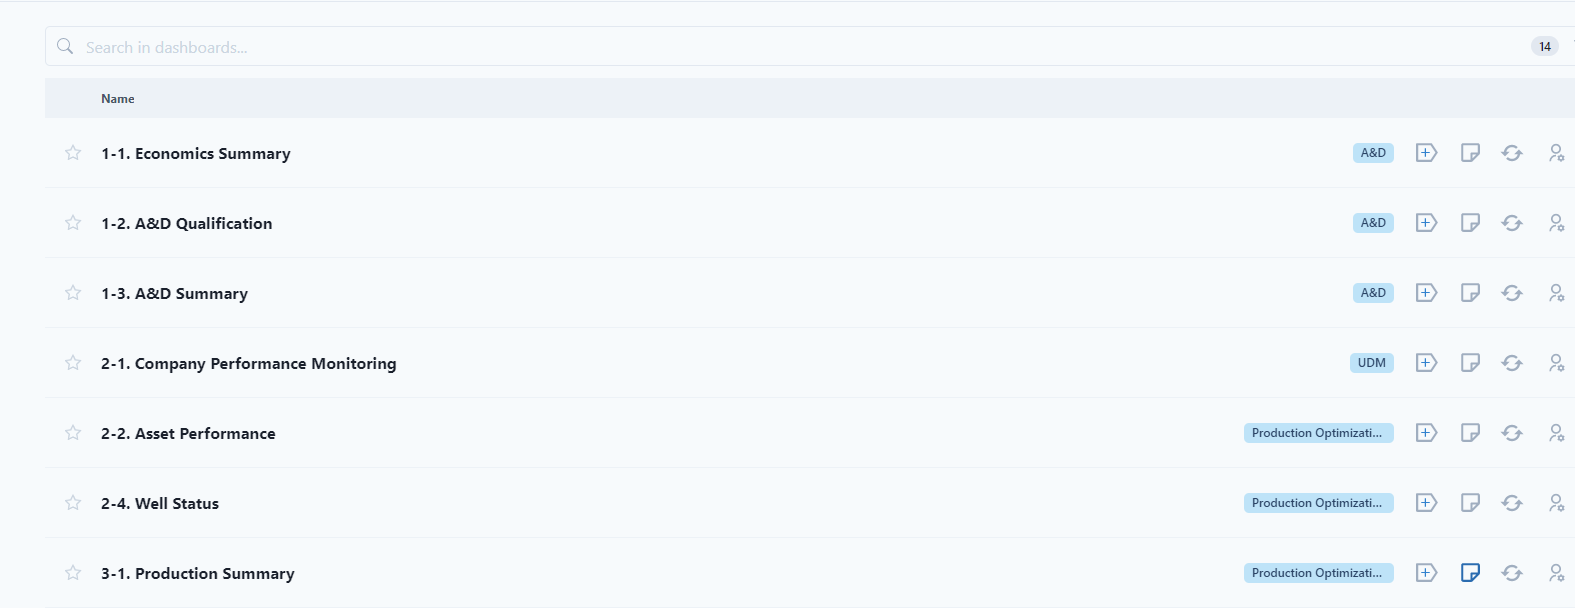
Dashboards
Dashboards allow users to visualize data and make decisions quickly.
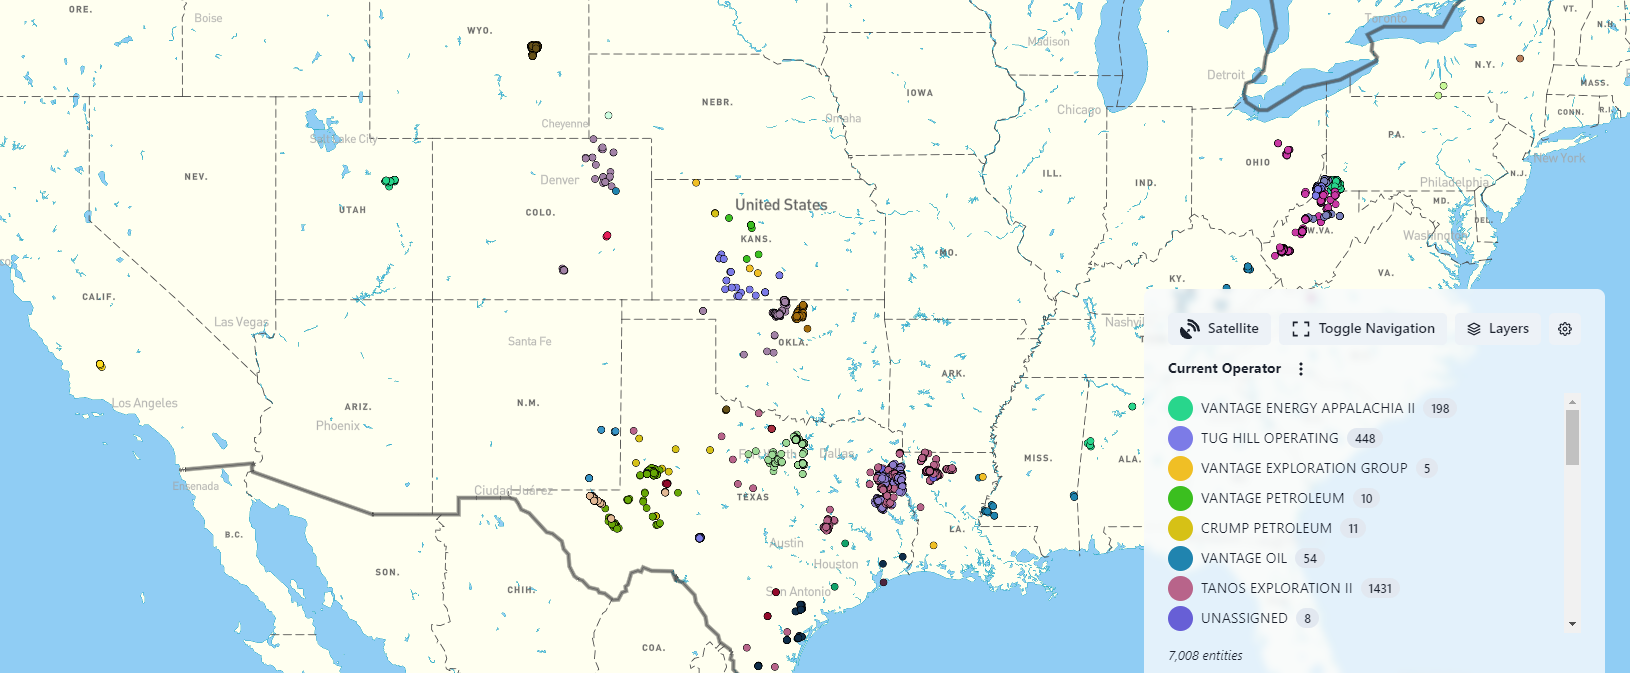
Maps
Maps increase visualization to easily see the location of entities. In order for this feature to work, entities need to have a latitude and longitude.
Data
The data tab allows users to manipulate and view data in many different ways, such as charts, tables, and statistics. It's easy to pull data sets to view and analyze.
Predict
Datagration extends data into predictive models through Decline Analysis (PetroVisor Only), Machine Learning, and Scenarios.
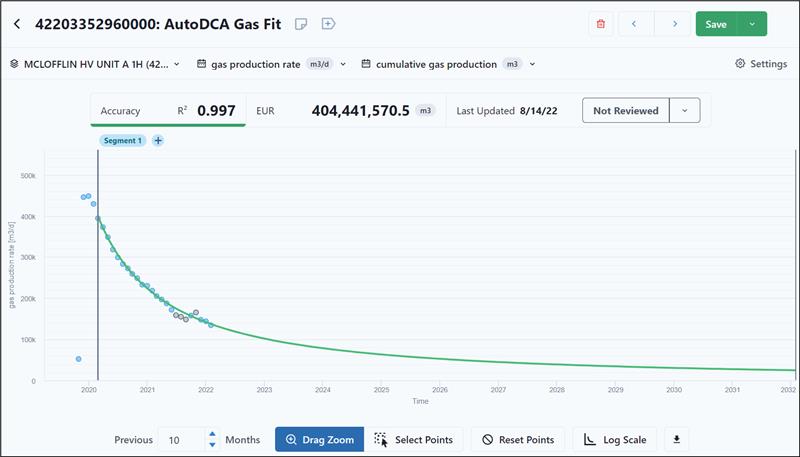
DCA
After running specific DCA workflows, the Datagration DCA models become available for analysis. Though Datagration has DCA, any decline curve can be pulled into the platform.
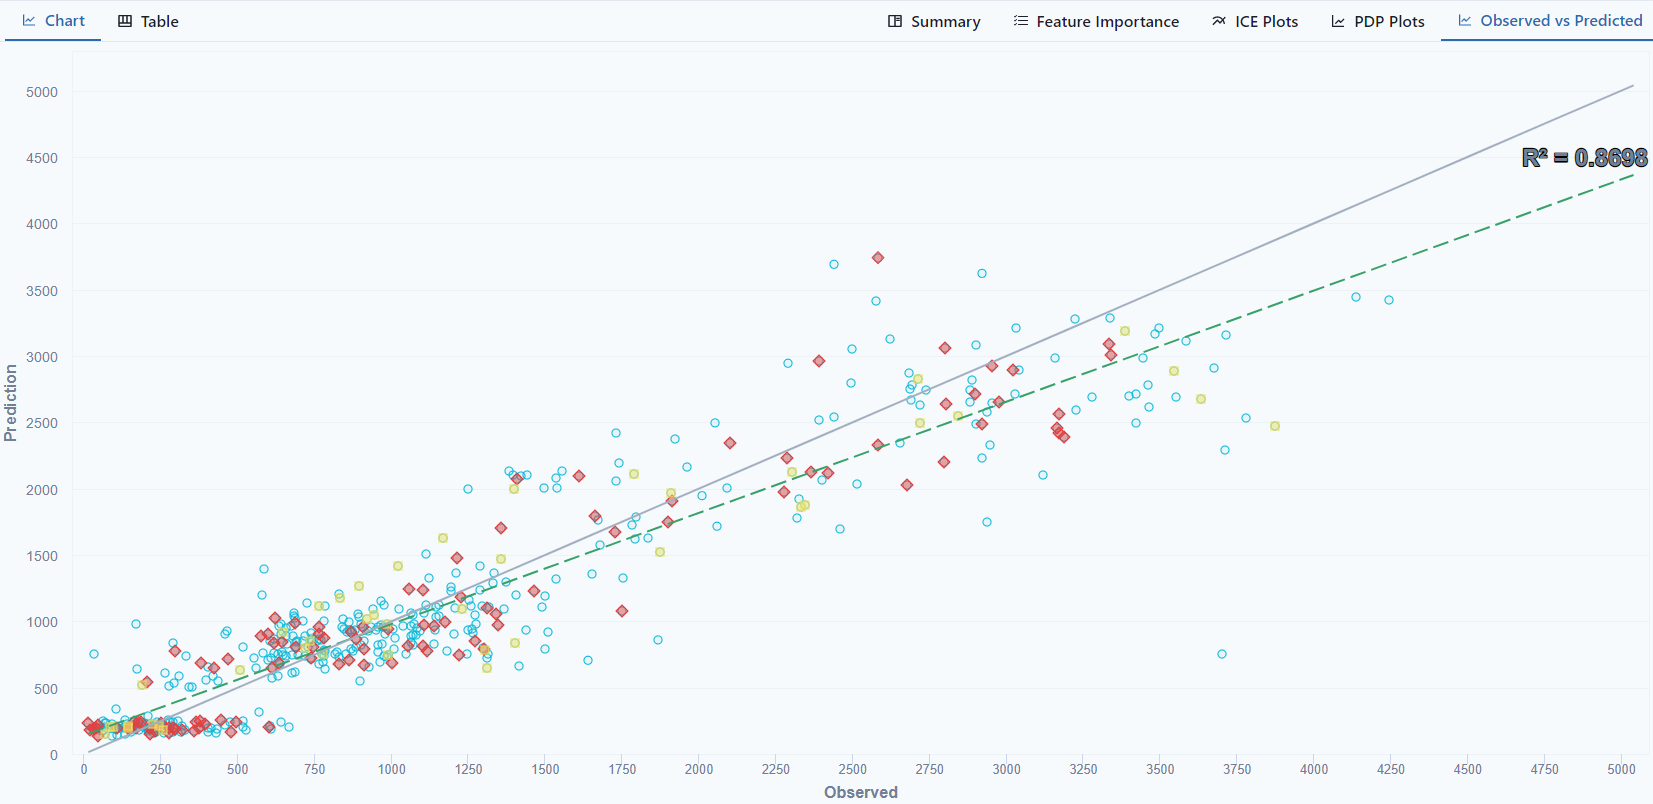
ML
Running predictive ML models, such as virtual flow meters, increase the data available in the platform. These models can then be put back into workflows to make data even better.
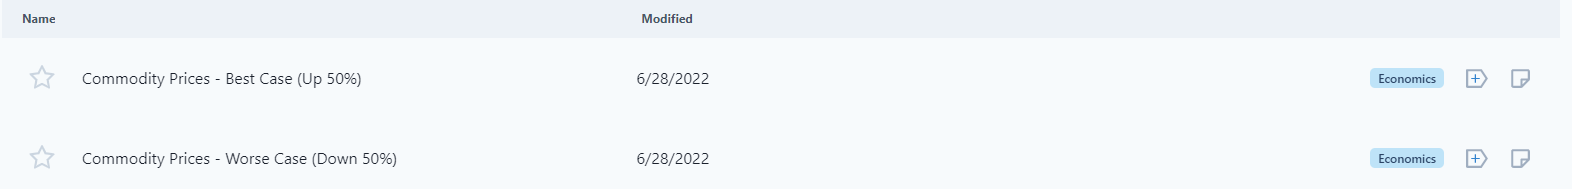
Scenarios
As data gets better, scenarios can be run to see what effects different variables have on results.