
Dashboards give you the ability to transform outcomes into powerful visualizations for real-time actionable insights, collaboration, and better decision making.
Datagration Dashboards
They provide at-a-glance views of key performance indicators relevant to operational challenges or business processes in the O&G industry.
This article has four sections:
PetroVisor / EcoVisor Dashboards
- Navigate to Dashboards.

- Click the desired dashboard to load.
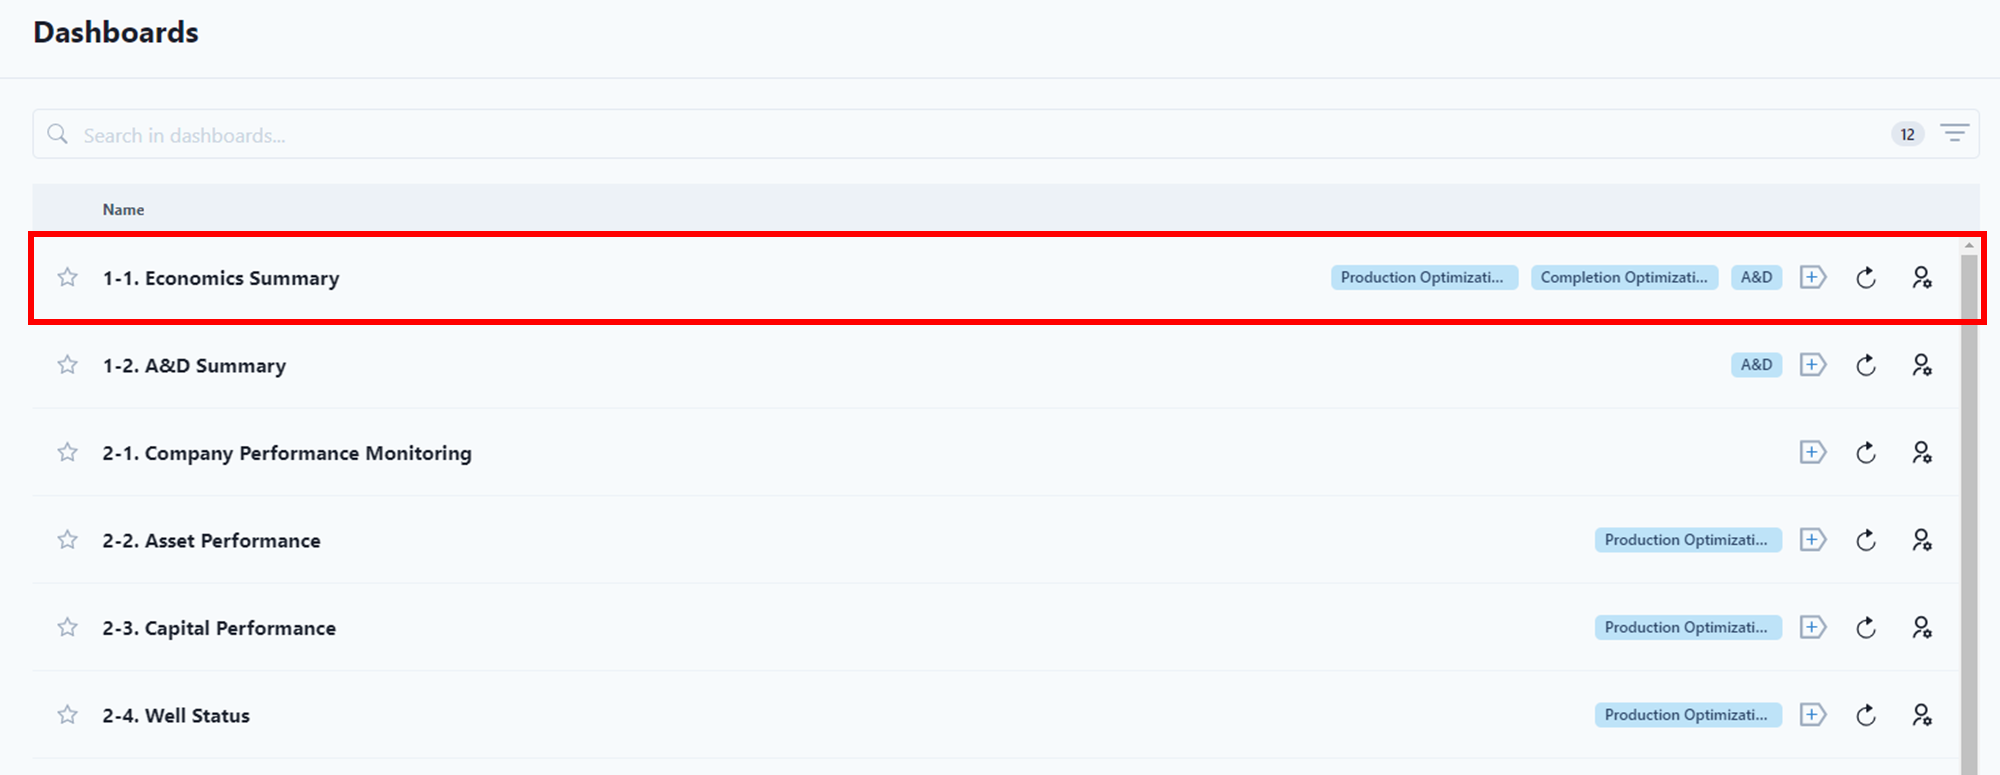
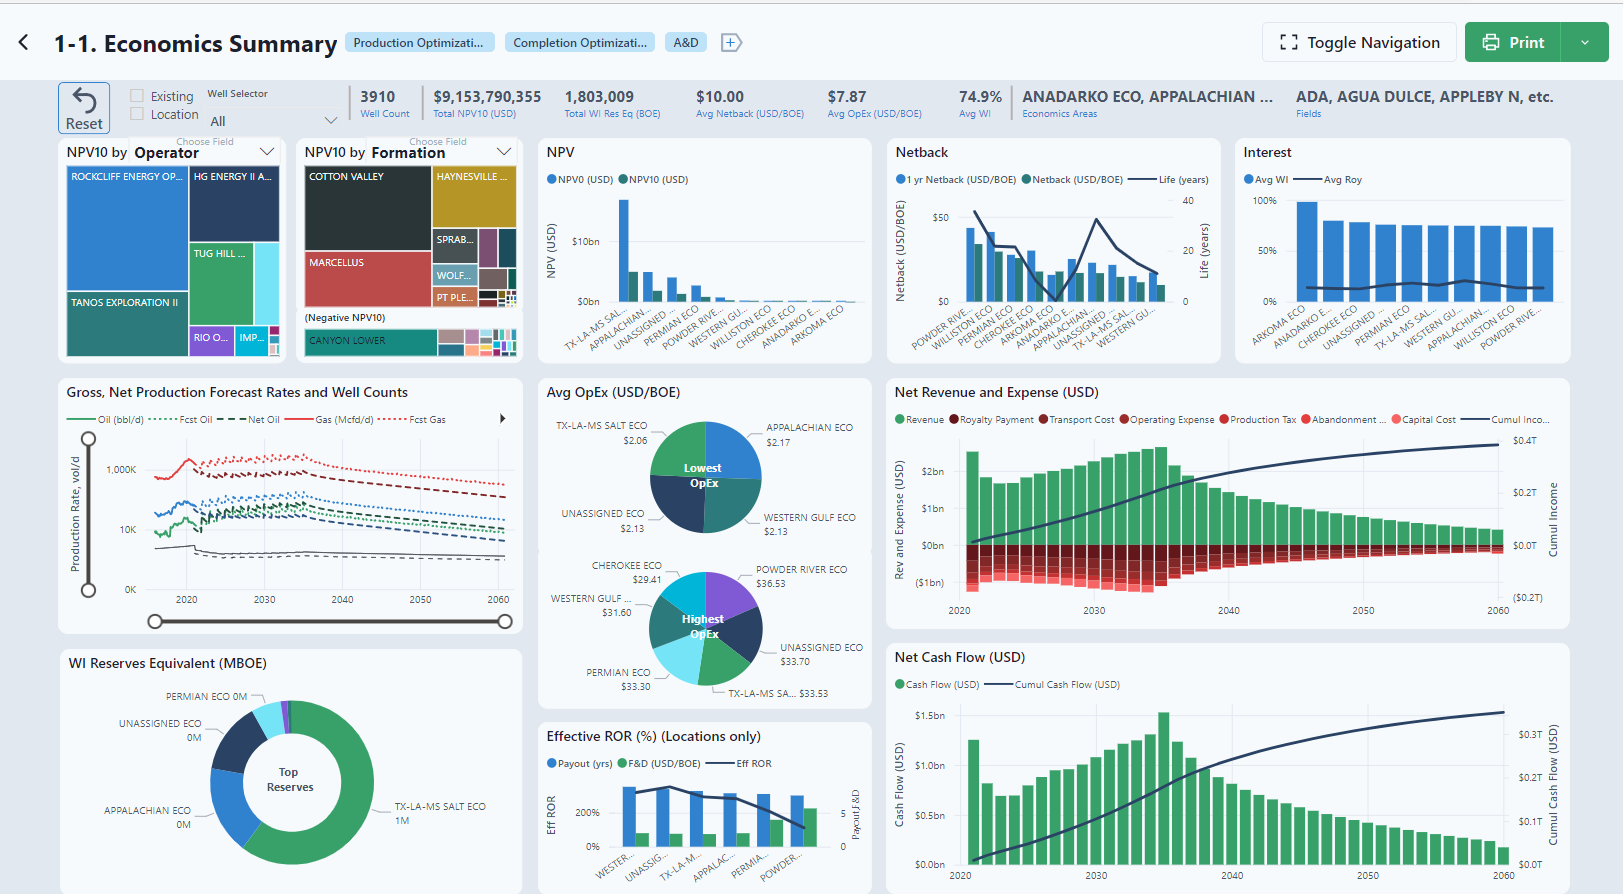
The selected Dashboard will be displayed on the right-hand side.
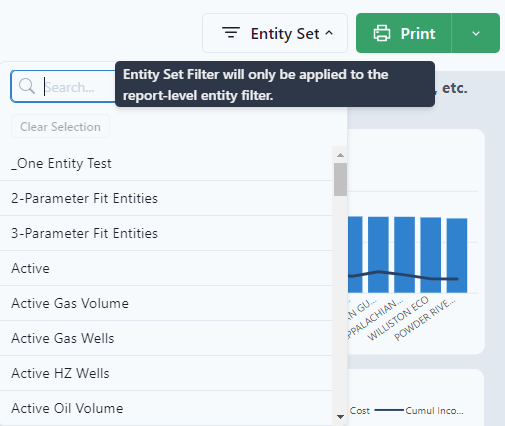
Dashboards that have entities have the ability to view by entity set. Select the drop-down "Entity Set" button to sort.
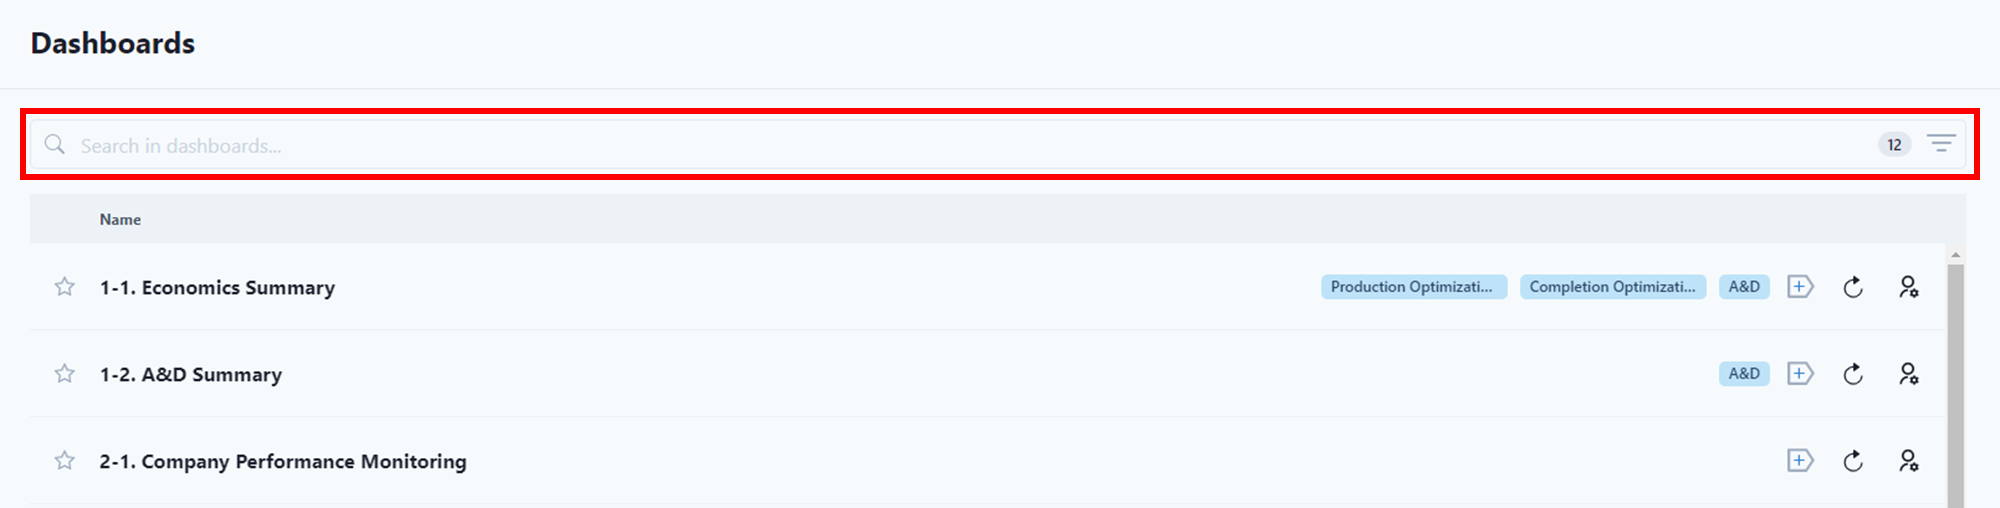
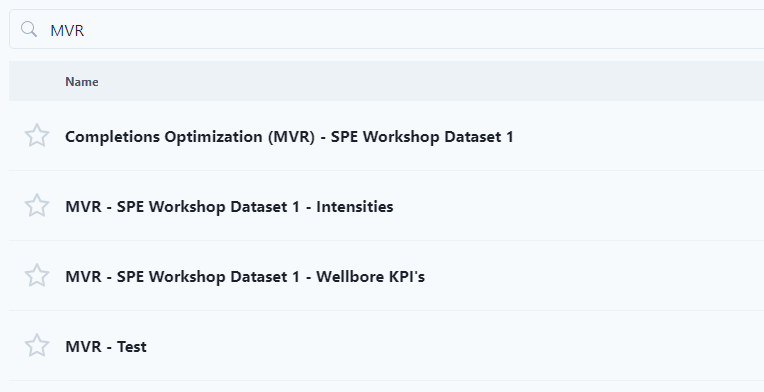
The Dashboards can also be searched using the search box at the top of the page.
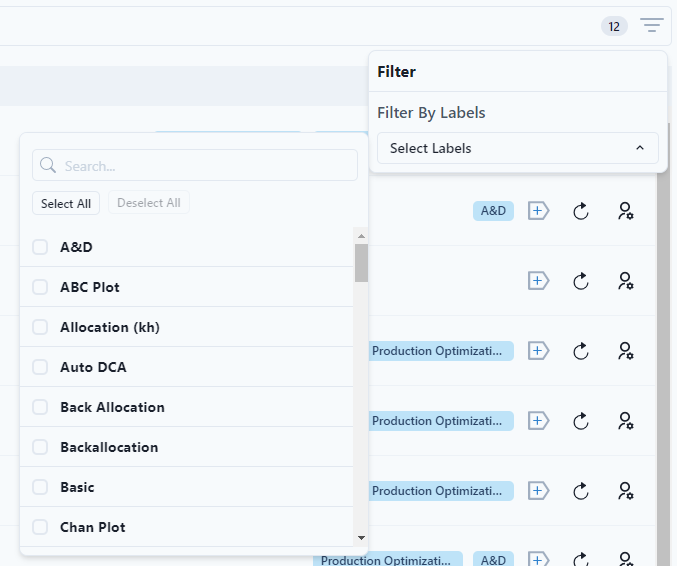
Filter
The Dashboards can be filtered by name and label.
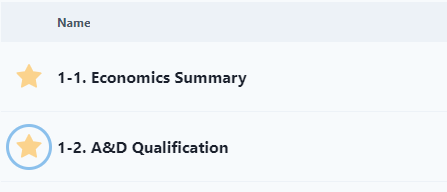
Dashboards can have a favorite by selecting the "Star" next to the name.
Dashboard Icons
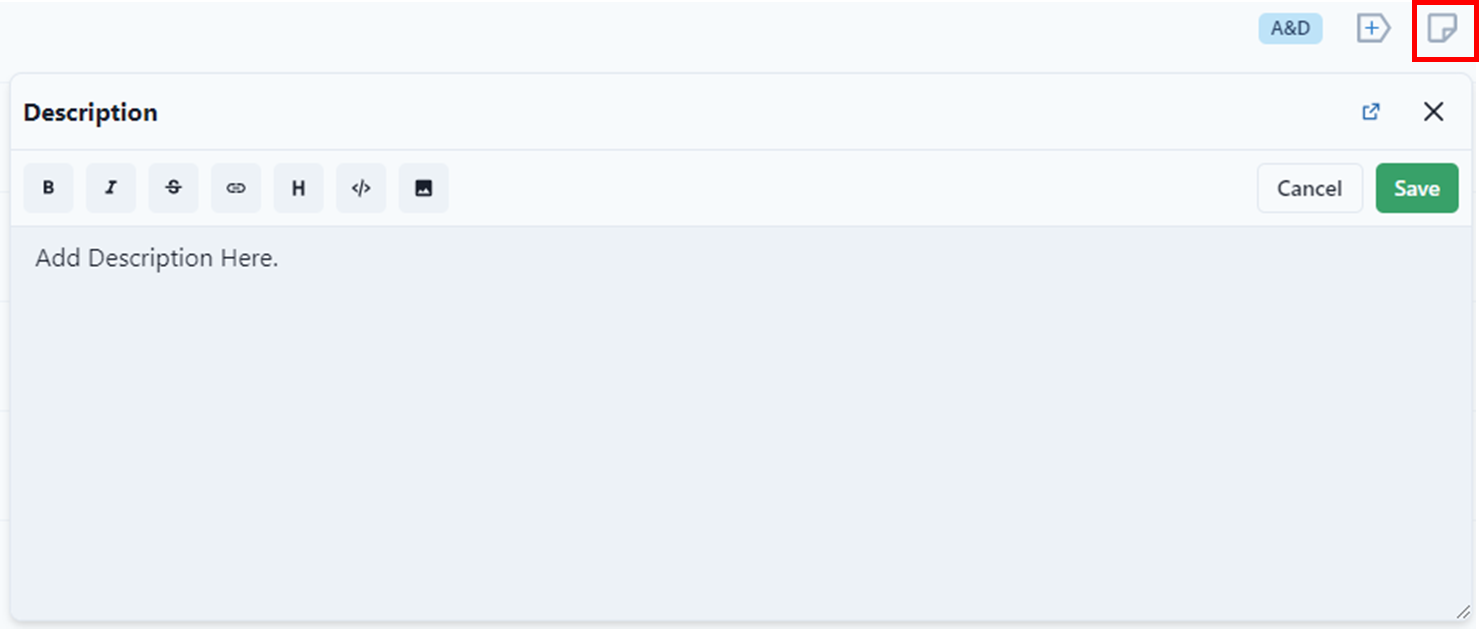
This field populates the "Workspace Documentation" in the Settings bar.
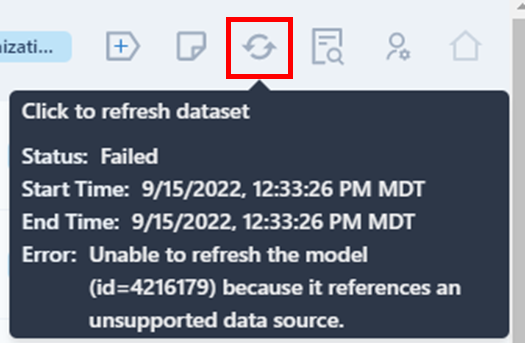
Data Source Summary

After clicking this icon, a pop-up screen will show the source information for that dashboard.


Upload Dashboards
Data sources will still need to be configured in the Power BI web app for the dashboard dataset, but clients can upload their specific dashboards.
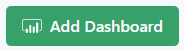
- Click on "Add Dashboard."
- Select "Select File."
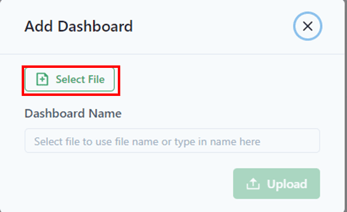
Note: Only .pbix files are accepted. These are files created in Power BI Desktop. Templates (.pbit) are NOT accepted.
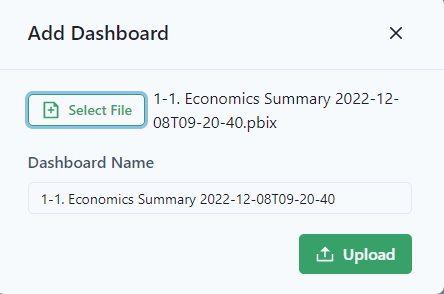
Notice that the file name matches the file selected. This file can be renamed.
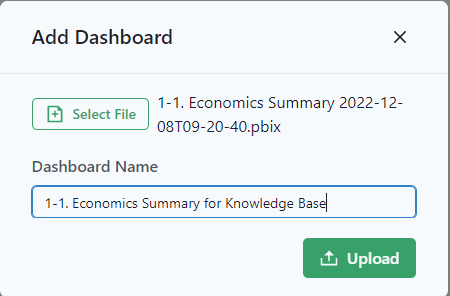
- Select "Upload."

Pro Tip: If the user wants to have multiple copies of the same dashboard with different cases, the user can download the Datagration dashboard, upload it and rename it. An example would be for MVR. The MVR Dashboard could have multiple cases. The user can run a case, download the file and rename with the case.
Download Dashboards
Users can download dashboards.
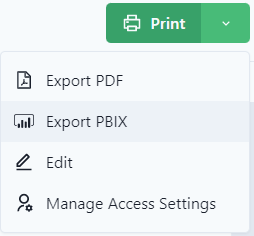
- Select the drop-down menu under Print.
- Select Export PBIX.
A screen will pop-up when the download is ready.
- Select "Close."
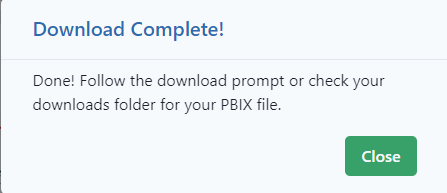
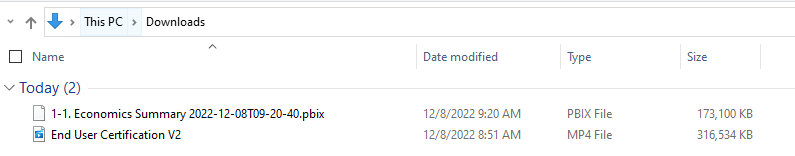
The file will download to the user's "Downloads" folder.
The difference between Print and Export PDF

- Print will print with all filters selected
- Export PDF will export all tabs with no filters selected.
PetroVisor / EcoVisor Dashboards
The platform has the feature to add charts from Data filters into a simple dashboard.
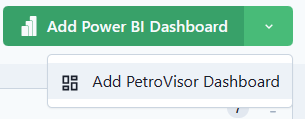
- Use the drop-down menu to "Add PetroVisor / EcoVisor Dashboards."
- Select "Add Card."
Each card represents a chart added. A card can also be text similar to the documentation. Notice in the example below, you see one text card (with Mermaid annotation), a chart, and a New Card selection.
Charts can be pulled from P# Scripts or Data Views. The text is developed on the card.
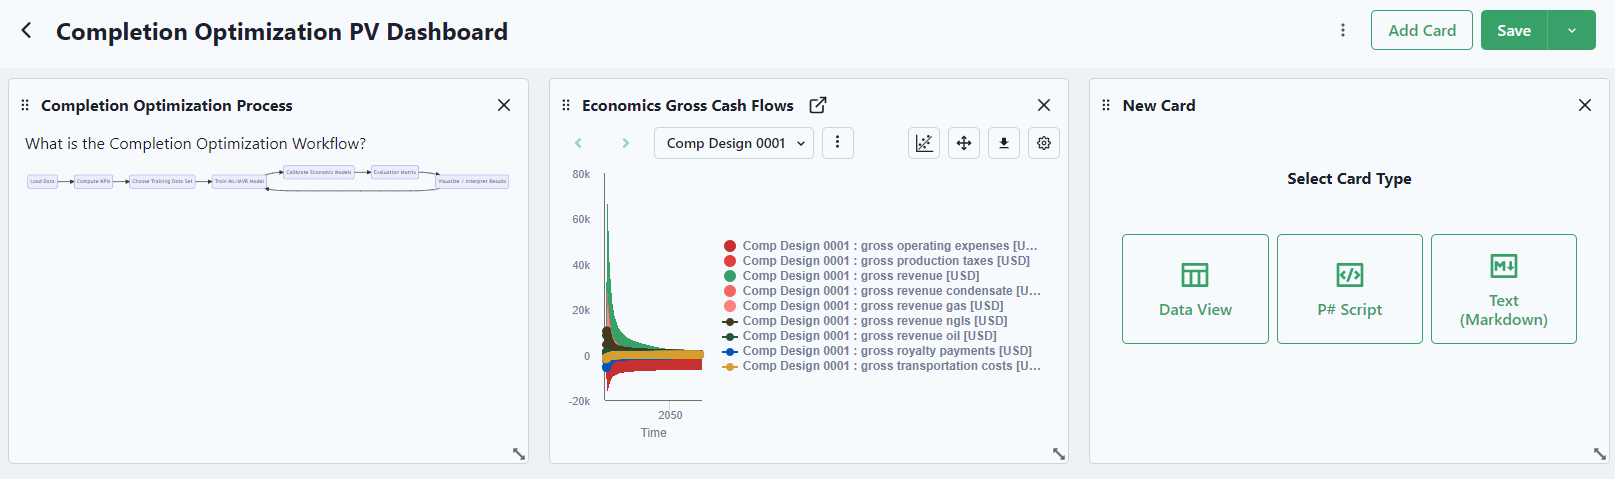
At the bottom right of the card, users can change the size and rearrange them.