The signal summary page allows the user to find all the information associated with that signal.
Signals are an important part of the Datagration Data Model.
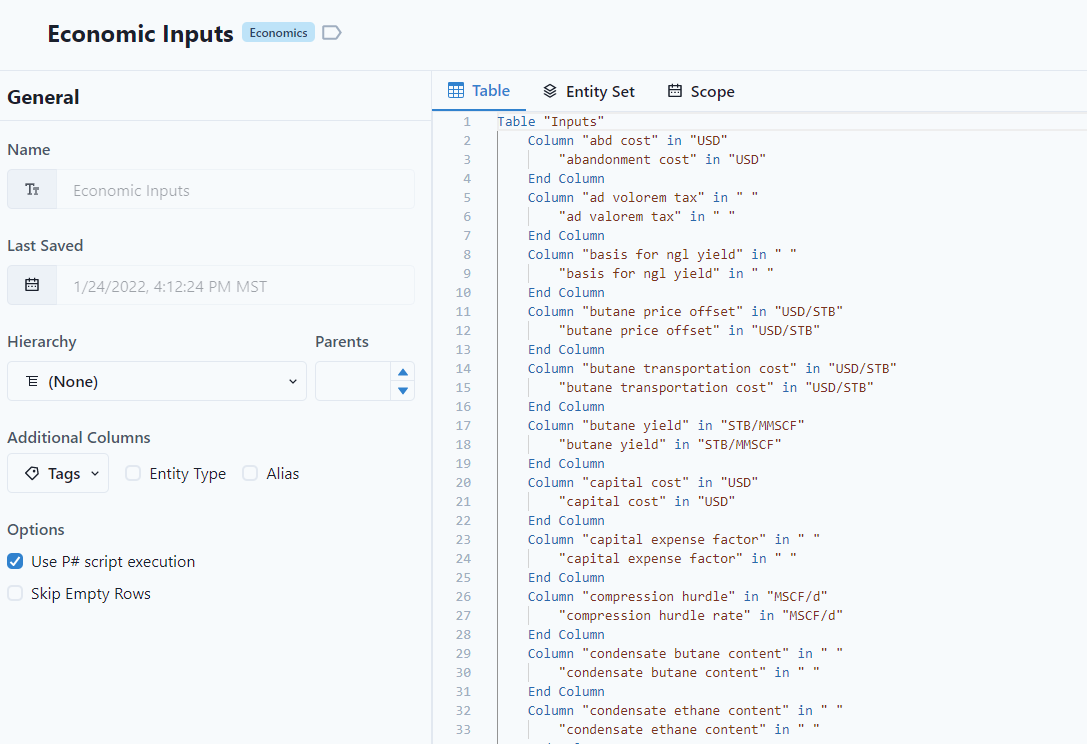
Signals are specific data that is measured from an entity. Signals can be static or dynamic (time-based), depth dependent or PVT. Some examples would be daily production, depth, total barrels. Signals need to have an assigned unit of measure.
To navigate, to signals, click on the Signals on the column on the left.

A list of signals for that workspace will appear. The user can use the filter or search bar to find a specific signal.
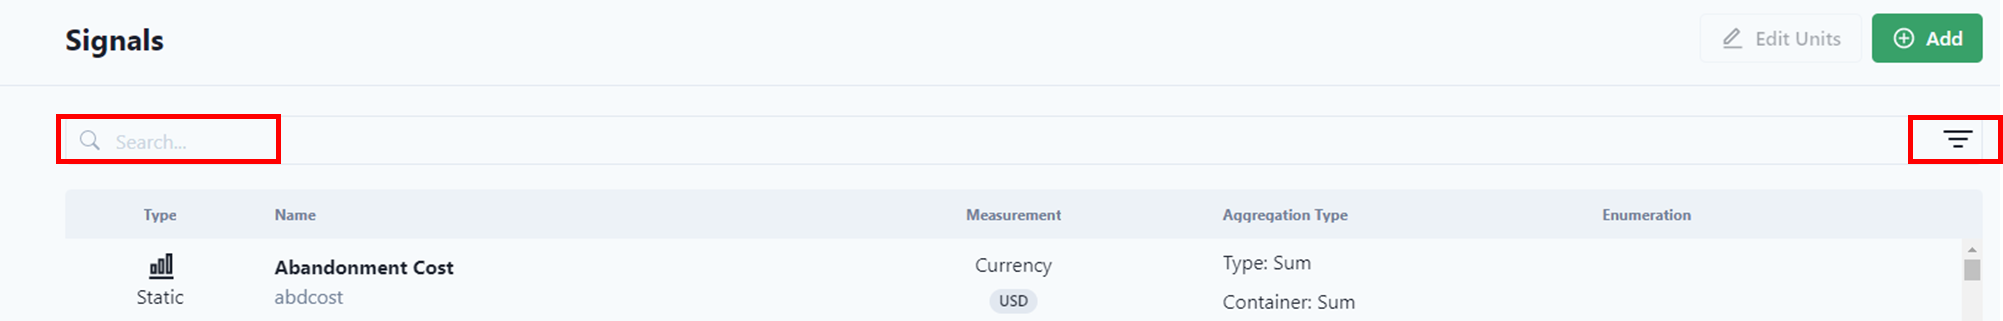
Tags and descriptions can also be added to signals.
After Selecting the signal, information pertaining to the signal will be displayed.
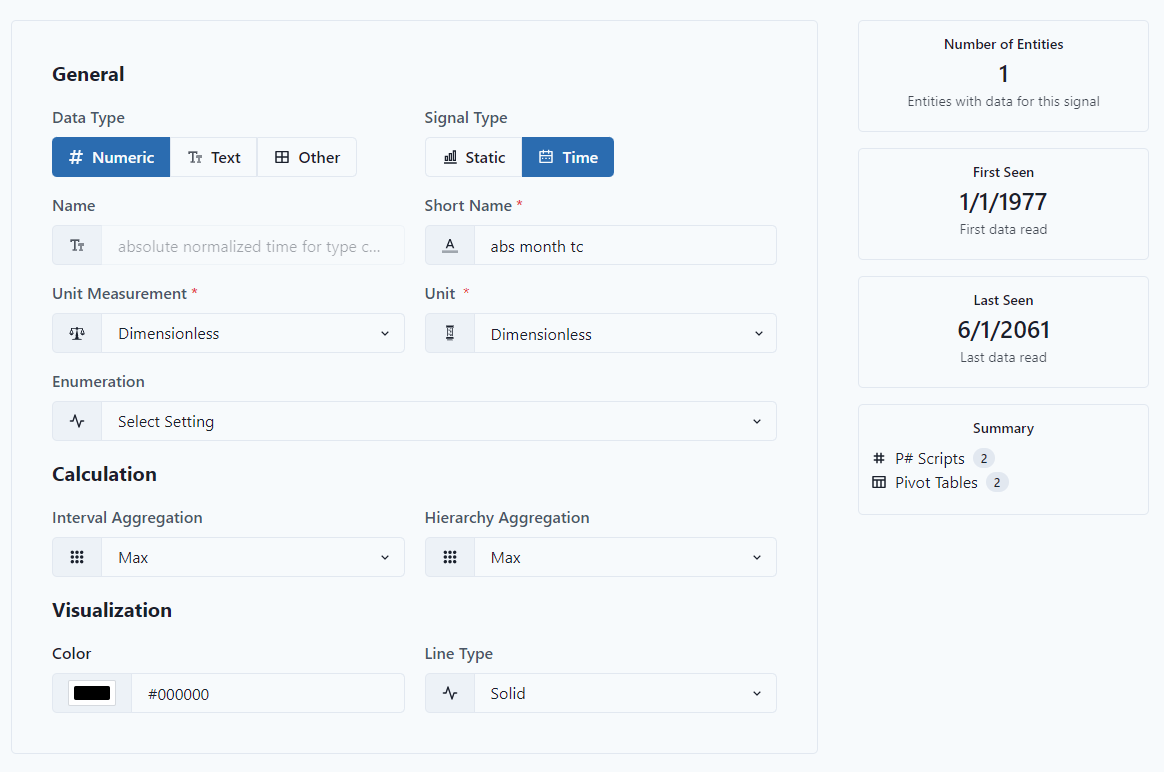
Notice the information types.
General
Data Type: Numeric, Text or Other
Examples of Numeric data would be production rates.
Text data would be well name or formation name. Another way to use text would be to assign an alternative time to a specific signal, giving it a different way to view time data.
Other would be depth or PVT.
Signal Type: Static or Time dependent
Name: Name of the signal
Short Name: abbreviated name
Unit of Measurement: The type of measurement used, i.e. Currency, Area, etc.
Unit: Measured unit, i.e. USD, years, etc.
NOTICE: The measured unit will be filtered by the unit of measurement.
Enumeration: It assigns an Enumeration typed Workspace Value to the signal; the Enumerations in the Workspace Value are then used to give a label to specific values when using the data view.
For example, there could be a Workspace Value called "FILTRU DUPLEX" and its Enumeration can look something like:
FILTRU DUPLEX 2/5: 1,
FILTRU DUPLEX 2/6: 2,
etc
If a signal has that Enumeration assigned to it, then whenever the signal has values of "1, 2, etc", it will instead show "FILTRU DUPLEX 2/5, FILTRU DUPLEX 2/6, etc" in the data view.
Calculation
Interval Aggregation: how the signal is aggregated by interval, meaning time or depth.
Hierarchy Aggregation: how the signal is aggregated in groups, similar to Parent / Child relationship.
Visualization
Color: color displayed in visualization
Line Type: type of line displayed
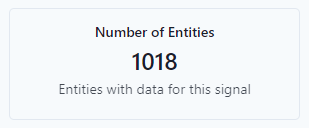
Entities with that signal.
Clicking on the Number of Entities Box, all of the entities with that signal are shown.
After clicking on the box, it will display a list of all the entities that contain that signal.
Notice that a search bar makes it easy to find a specific Entity.
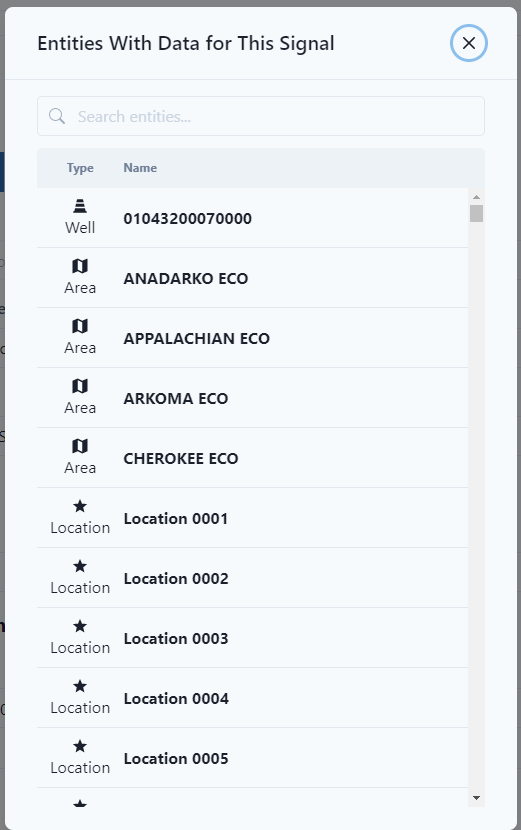
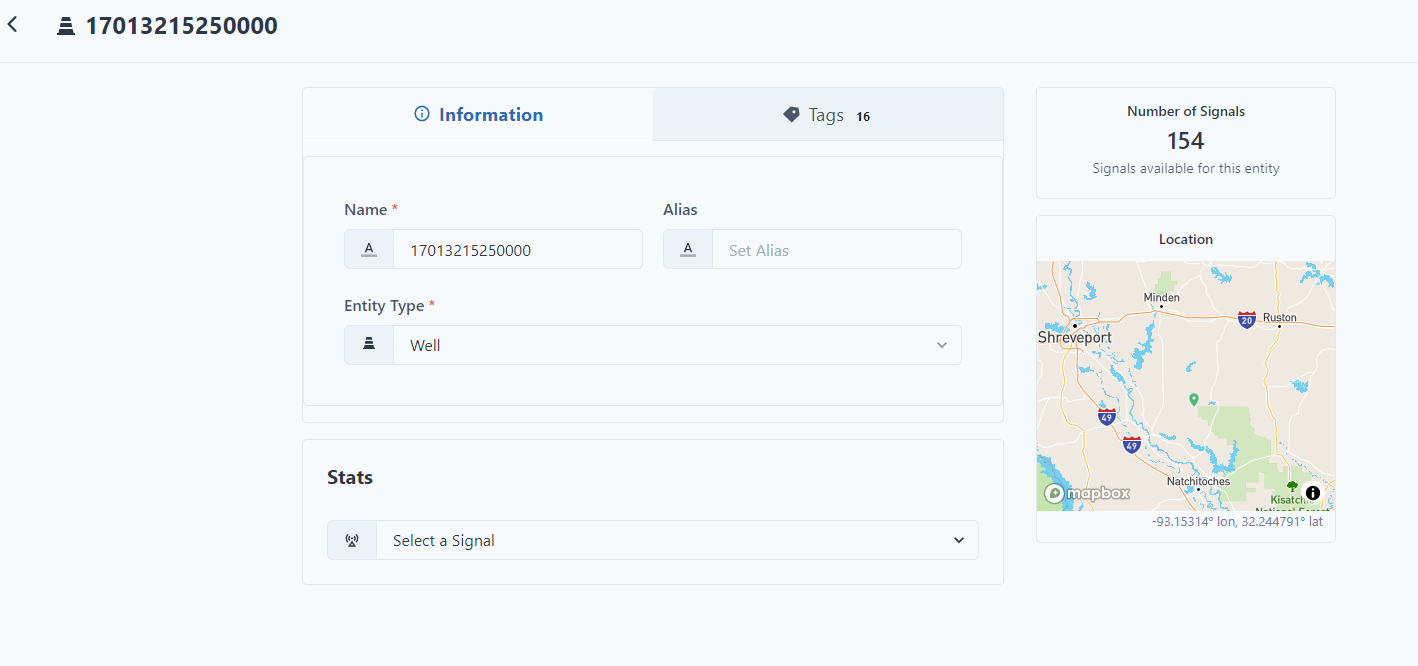
Clicking on any of the entities will open the entity summary page.
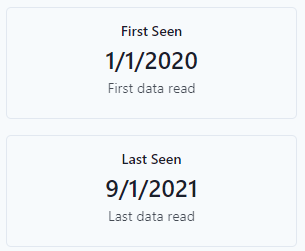
Range information
Range information (Time Dependent - First Seen & Last Seen as well as Other- Depth information) is available for Numeric, Text, and Other Data Type.
Summary
On the summary box at the bottom, the user can find more detailed information on data sources, pivot tables, workflows, and scripts. Clicking on the box displays the information.


The user can further click into the data. The example below shows the pivot table with this specific signal.