-
Getting Started
-
Customer Training
-
Customer Success
-
Updates
-
Production Optimization
-
Artificial Lift Optimization
-
Completion Optimization
-
Environmental, Social & Governance
-
Development, Acquisition & Divestitures
-
Enhanced Oil Recovery
-
Admin
-
P#
- Getting Started with P#
- Data Cleansing
- String Functions
- Scenario Functions
- Regression Functions
- Placeholder Functions
- Neighborhood Functions
- Mathematical Functions
- Logic Functions
- Entities Function
- Moving Window Functions
- Time and Date Functions
- Statistical Functions
- Economic Functions
- Data Handling
- Additional Functions
- Directional Functions
- Machine Learning Functions
- DCA Functions
-
Packages
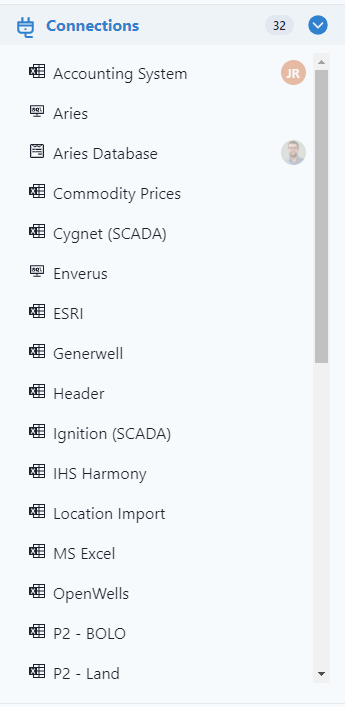
How do connections work in PetroVisor?
Connections are where PetroVisor connects to data, like an excel file or Petrel.
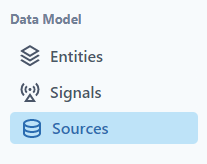
In PetroVisor, Connections can be found in the Sources tab of the Navigation Panel.
Here is a video showing Connections and Sources.
Add Connection
To add connections, click the green plus sign to the right of Connections or select the green Add New Connection button on the top right of the screen.


Each Connection Type has different variables that need to be entered.
Connection Types Available, click on link for specific update instructions:
- CSV
- TXT
- Excel
- SQL
- LAS
- Oracle
- Teradata
- ODBC
- PI
- Smartsheet
- DataBricks
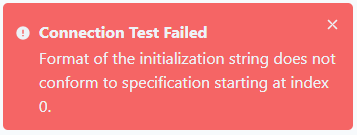
Test Connection
After the user has established the connection, the user can test the connection. A pass or fail will appear in the bottom right of the screen.
Pass

Fail
Preview Files
Some file types allow the user to preview the files from the connection. Click the Preview Files button.
This action will open a pop up window displaying the information loaded. Below is an example of an Excel file.
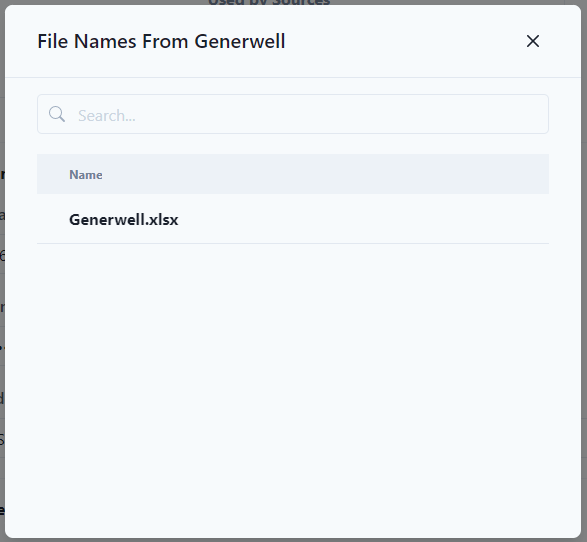
Notice that to bring in multiple files with the same starting name, PetroVisor accepts wildcards (*) and will bring in multiple files.
Add Connection
Once the connection has been tested, click Add Connection.

The connection will be available in the Connections list.