The DCA tool in PetroVisor allows for easy production forecasting using the Arps decline curves.
Decline Curve Analysis (DCA)
Overview of the tool.
Decline Curve Analysis (DCA) is an industry standard method of forecasting the future production of oil and gas wells. The PetroVisor DCA tool, found under the Predict section of the navigation bar, allows you to quickly and easily fit a decline curve to production data.
Our tool uses the Arps equations and allows you to create multi-segment fits with exponential, hyperbolic, and harmonic decline curves with terminal decline. The tool will automatically generate the best-fitting model based on a least squares regression for your selected data, and will allow you to easily adjust the model parameters and remove outlier data points manually.
Using the Tool
After logging into PetroVisor, select the DCA Tab under Predict.
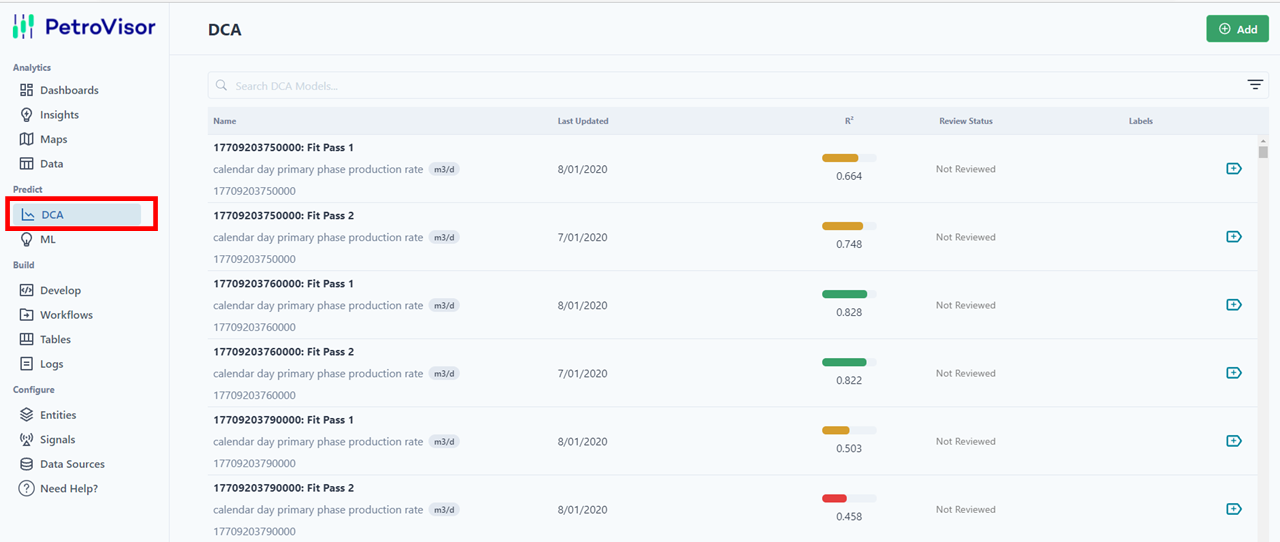
All of the DCA models for the workspace are listed. The items are generated through the auto DCA workflows in the workspace.
- The well list shows the "Name." The "Name" is the model name, entity, and signal associated with the model.
- The "Date" shows the time range for the associated model.
- The R² value shows the variance associated with the curve. In PetroVisor, models are highlighted
- Red for models with an R^2 < 0.5. These also get flagged with “Review Needed."
- Yellow for models with a R^2 between 0.5 and 0.75.
- Green for models with a R^2 greater than 0.75.
- The "Review Needed" column highlights all the DCAs that need to be reviewed by an end user. PetroVisor automatically flags wells that have a low R² value (<.5).
- Labels can be added to wells as required. This knowledge base article explains how to add labels.
To select a model, click on the list item. The entire item will be highlighted prior to clicking.
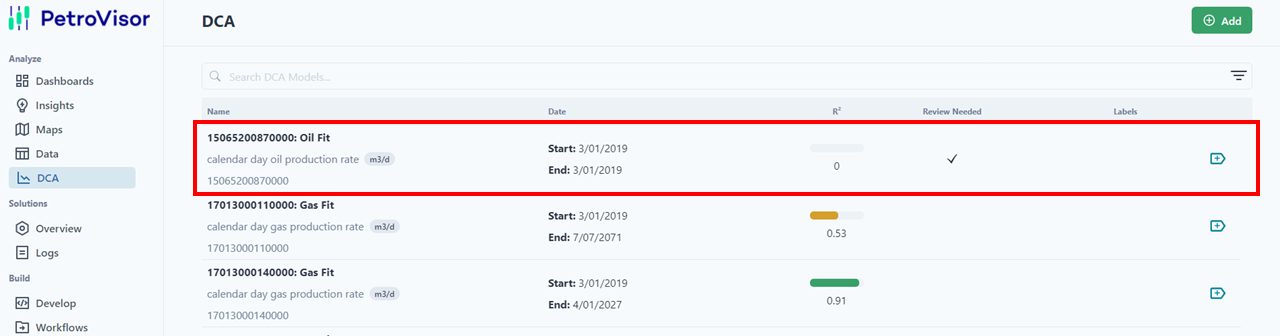
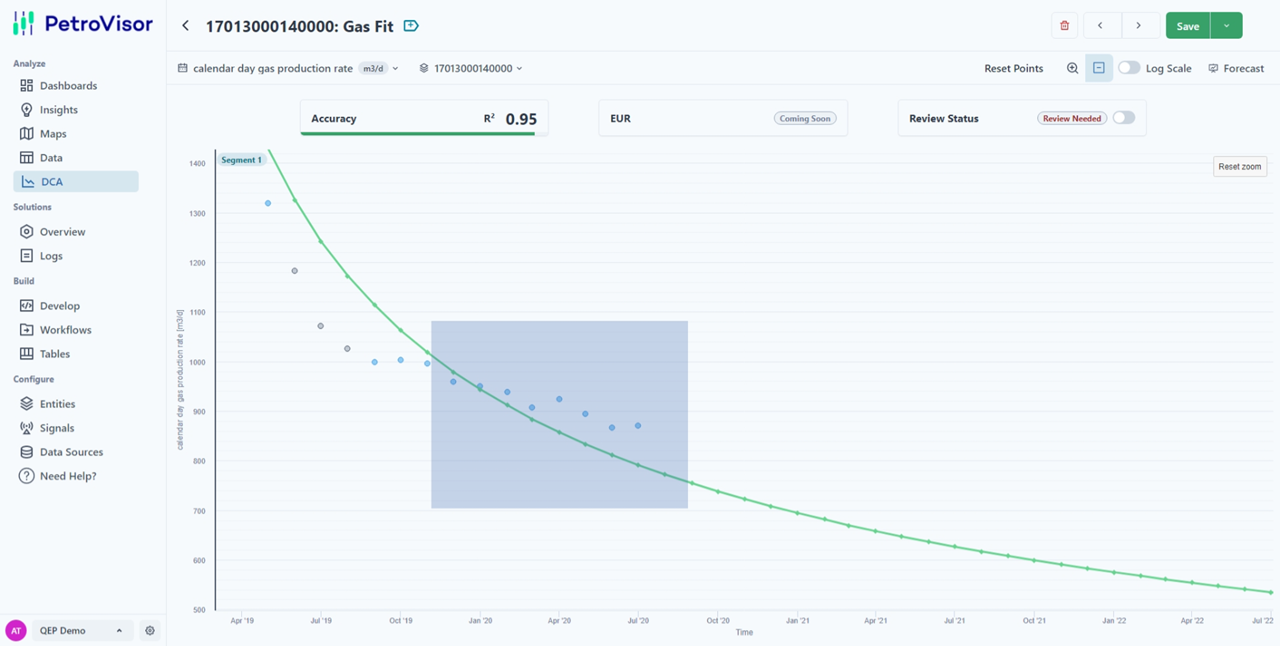
After selecting the item, the user will see the chart for the DCA model.
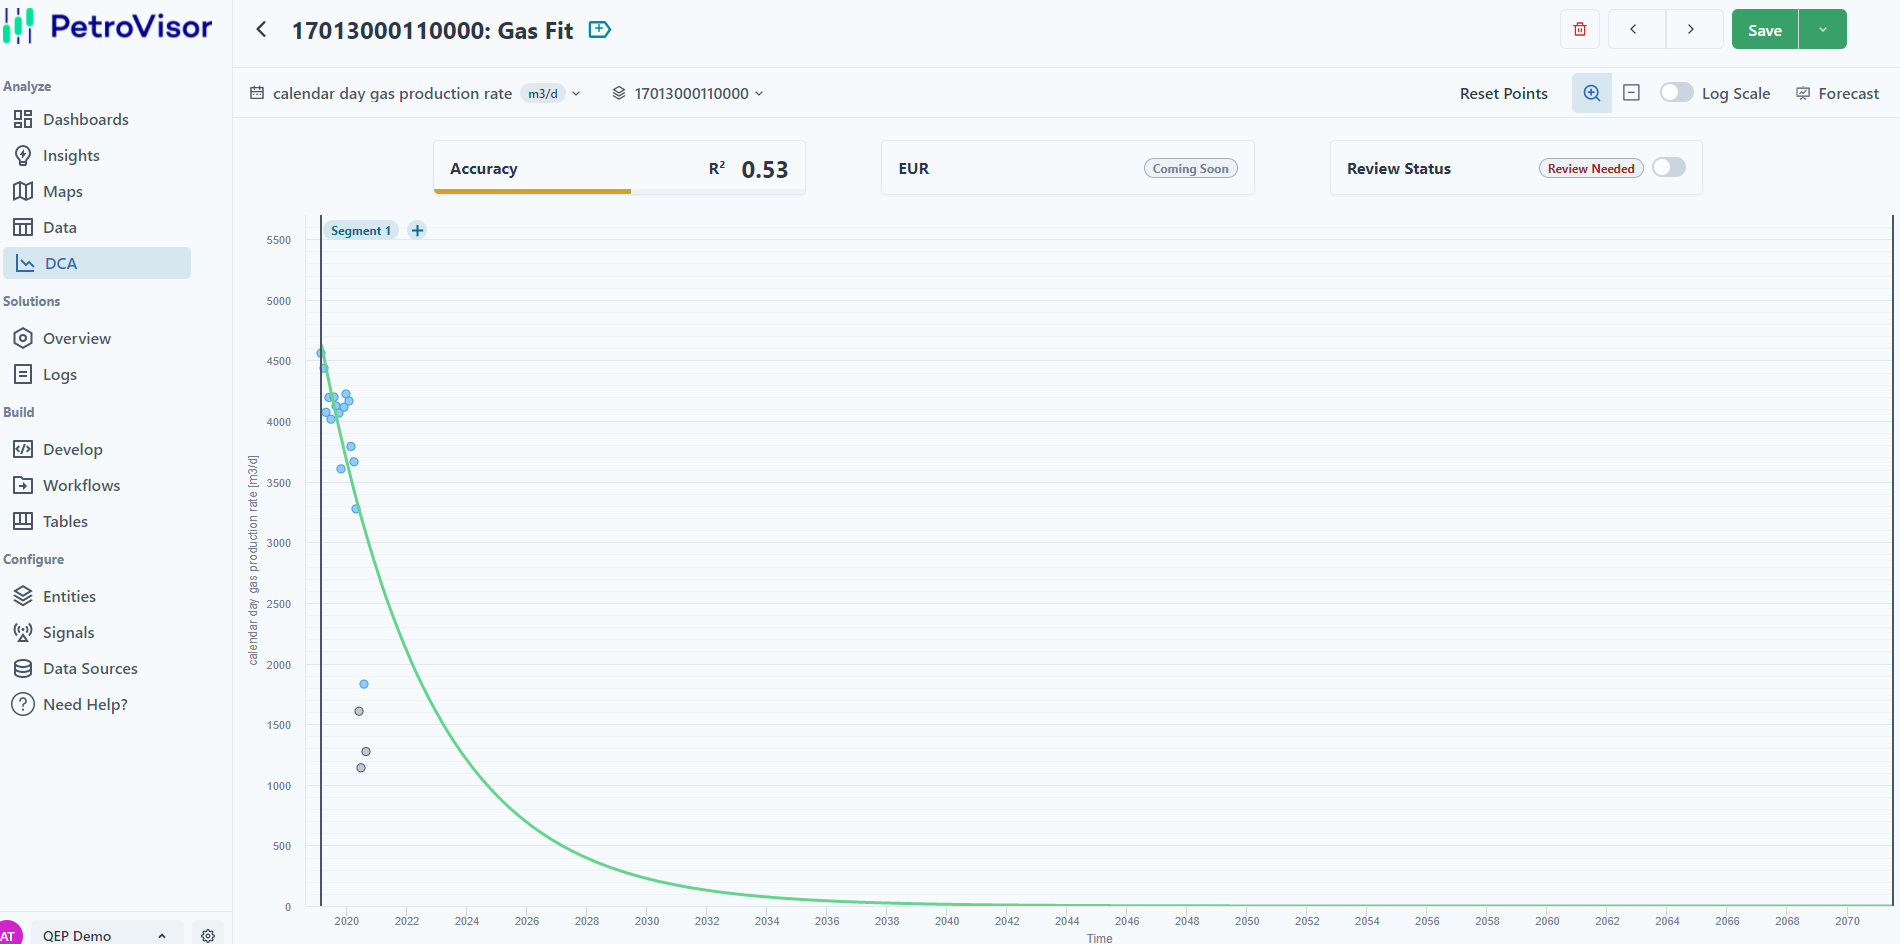
On this page, the user can interact with the following:
- Entity Selection
- Point Selection
- Zoom
- Segments
- Log Scale
- Forecast
Entity Selection
The user can select the entity, rate signal, and unit to load the data to be fitted and produce a curve.
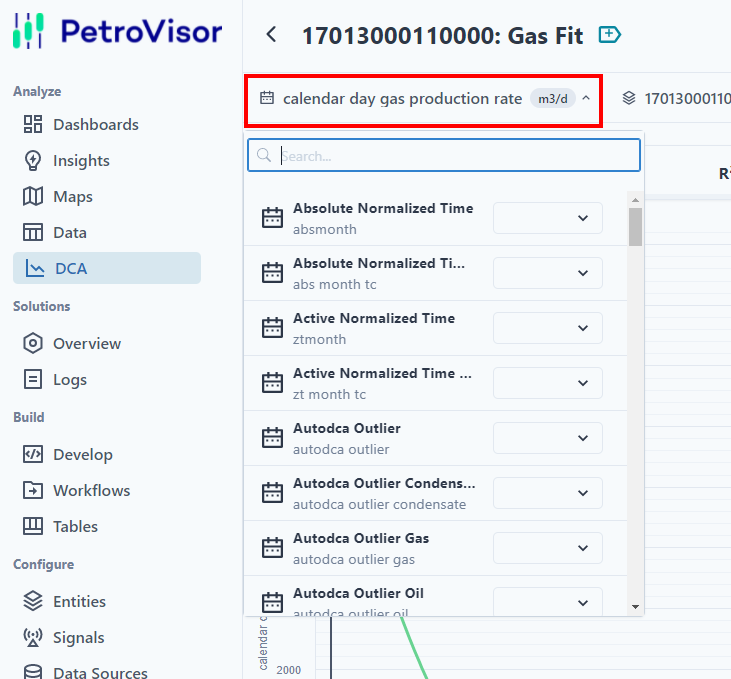
If there are no values associated with a selected signal, the user will see the following screen.

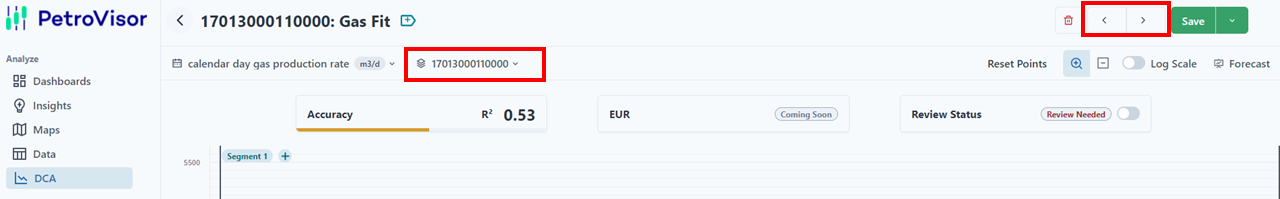
Entities can also be selected or the user can move through the list. The drop down list will allow the user to select a specific entity. The arrows at the top right will navigate the user through the entity list.
Point Selection
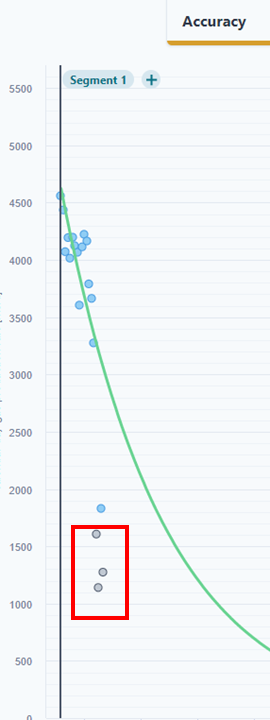
The DCA model allows selecting points that are outliers and exclude them from the curve fitting. They are highlighted gray. To exclude or include points, the user can click on the points.
If the user has many points and does not want to select individual points, the user can select points by clicking the "Select Points" button at the bottom of the screen.
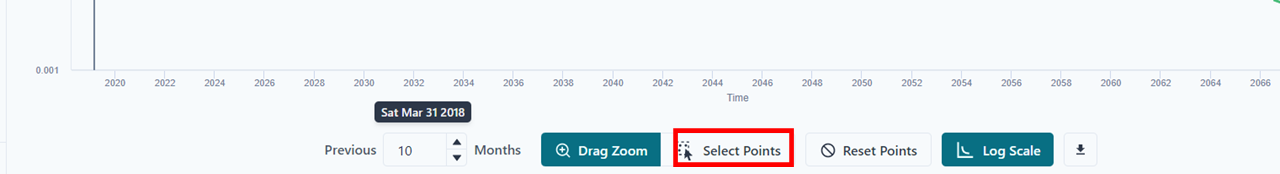
The user can drag the mouse to select points.
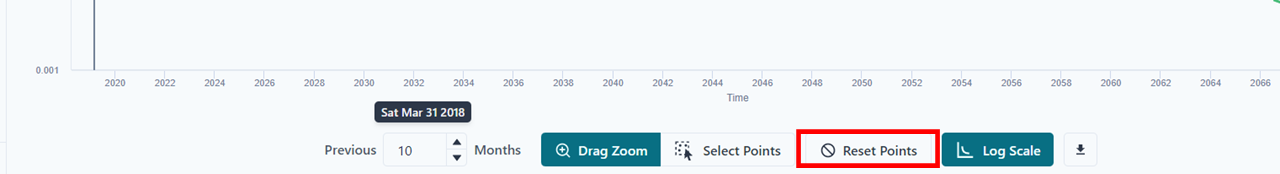
To unselect the points or to reset the entire curve, the user can click the reset button at the bottom of the page.
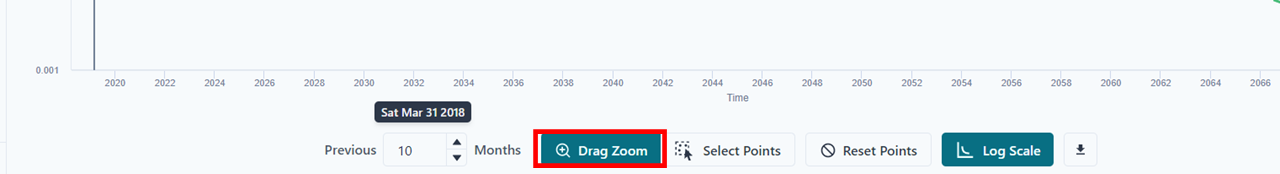
Zoom
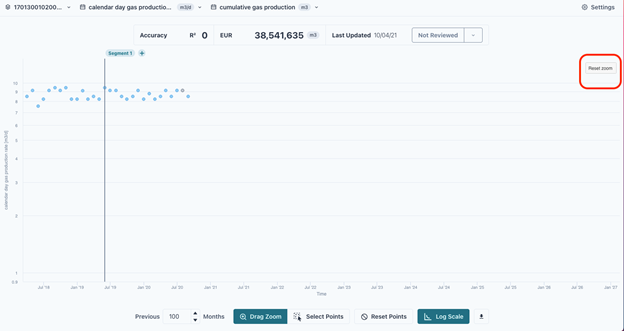
The user can also zoom into portions of the curve by selecting the zoom button.
To reset the zoom, the user can hit the "Reset Zoom".
Segments
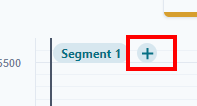
To add more curves, select the + next to the segment. The user can drag it to create another curve.
The user can also change the variables of the segment by clicking the gear Settings. The time frame and the type of curve can be easily adjusted.
All units are displayed in annual rate.
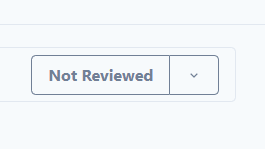
Review
The review functionality allows the user to flag wells that need to be reviewed. In PetroVisor, wells with an R² <.5 are automatically flagged. The use can select "Not Reviewed, Needs Review," or "Reviewed."
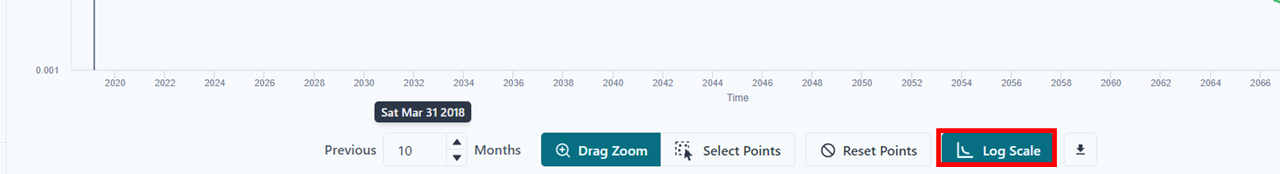
Log Scale
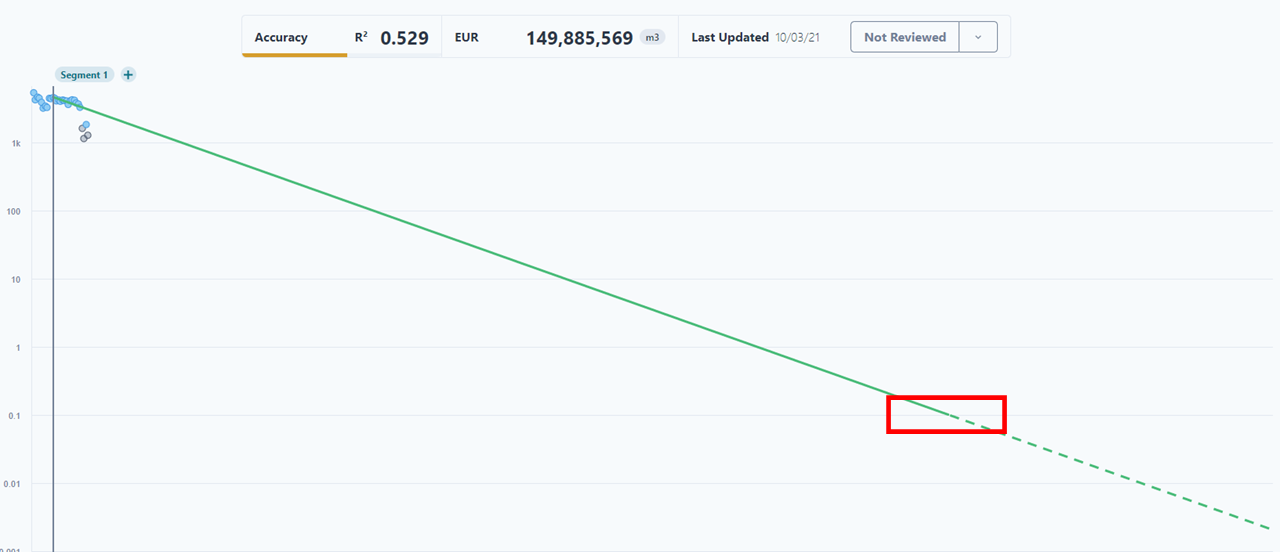
The user can change the scale to be logarithmic by selecting the "Log Scale" tag at the bottom of the screen.
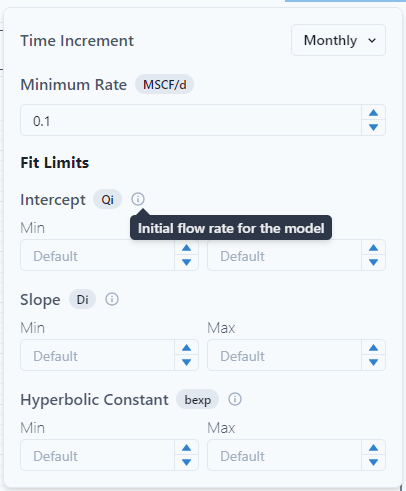
Settings
The Settings allow the user to change the time increment for the curve. The user may also set min and max limits for the curve fitter.
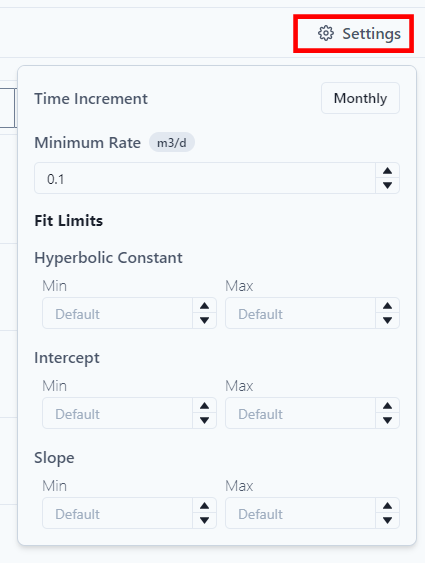
Note, when the "Minimum Rate" is reached on the curve, it becomes a dashed line.