This article gives an overview of the Sources tab. In order to connect to data, data first must be brought into the platform.
Click on the Sources tab in the PetroVisor navigation panel.
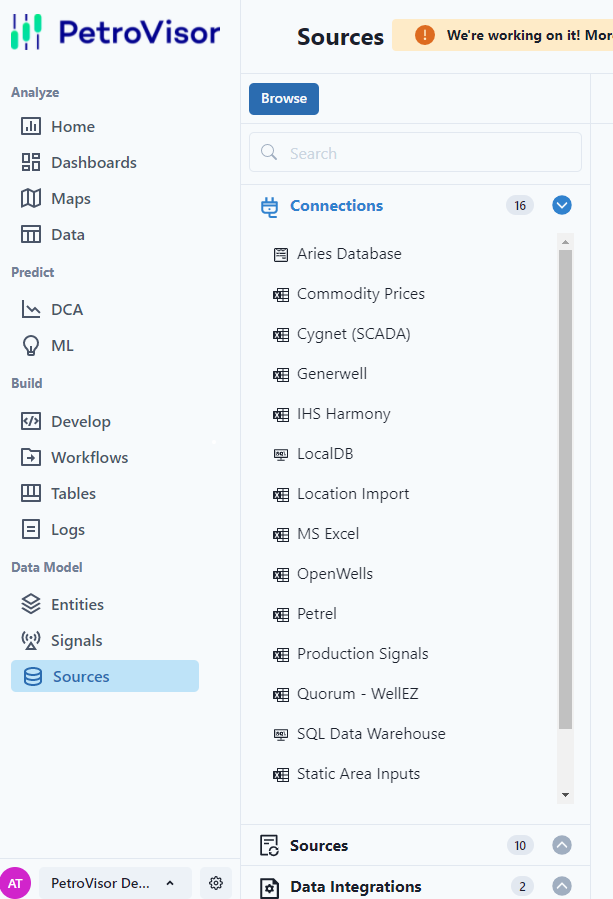
The panel on the right of the navigation panel shows Connections, Sources, and Data Integrations. The circle with a number after the name is the number of items in that section.
Connections are where PetroVisor connects to data, like an excel file or Petrel
Sources are data connections broken down by the type of entities they contain, like financial data over a time period.
Data Integrations are automations from data sources into PetroVisor.
Connections
Clicking on a specific Connection will give the user more in-depth information about the connection. In the example below, it is an excel file connected from a SharePoint site.

It gives the information to the SharePoint site, the type of file, the date it was created and last modified. For more information on Connections, see the article How do connections work in PetroVisor? (datagration.com)
Sources
Sources break down the connections by data type.
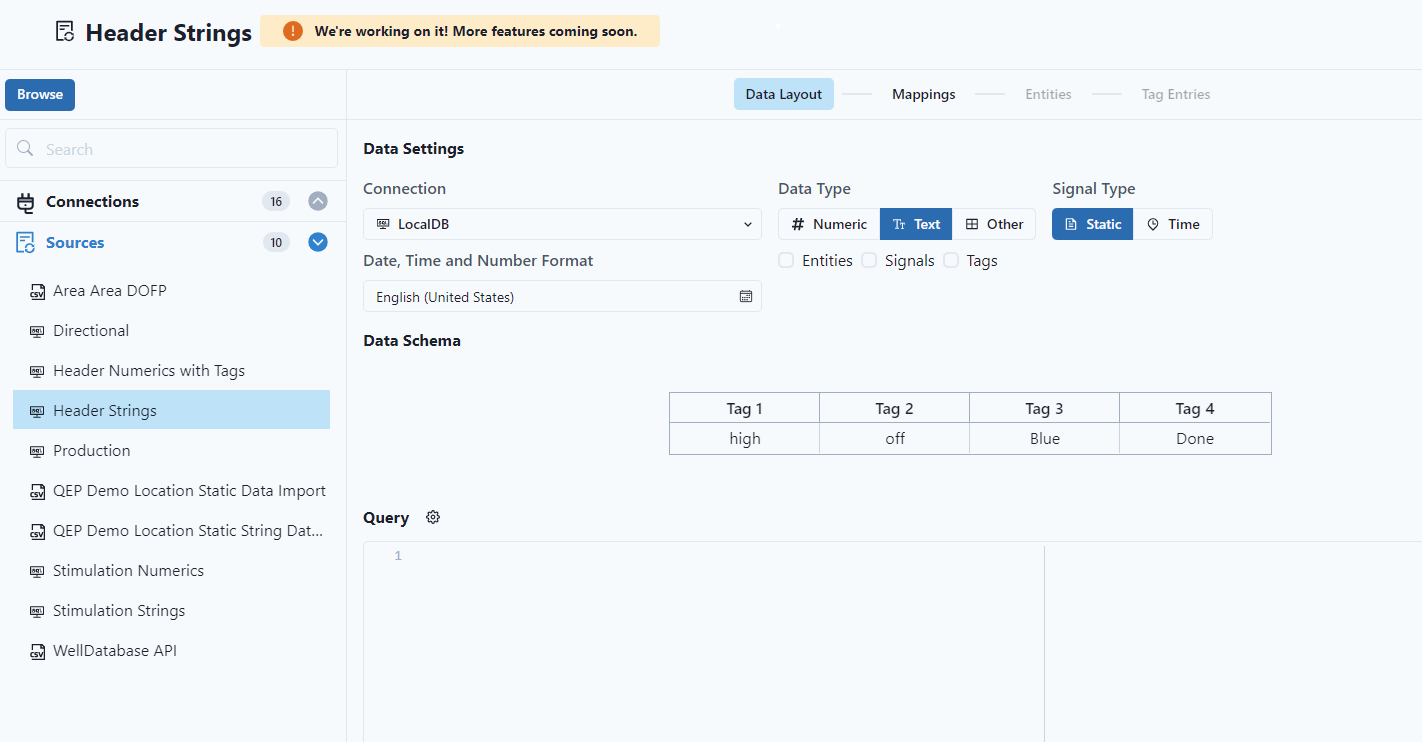
The user can easily see the connection, data type, signal type and tags. The user will also be able to see how the data is mapped, entities in the data set and the tags associated with the entities. For more information on Sources, see the article https://www.datagration.com/knowledge/how-do-i-map-data-in-petrovisor.
Data Integrations
Data Integrations shows the user the automatic data connections.

The user can see the data sources, if any data cleansing scripts have been run, how many records have been processed, total number of records, and total number of imported. The user can also "Run Data Integration" by clicking the green button at the top of the screen.