
-
Getting Started
-
Customer Training
-
Customer Success
-
Updates
-
Production Optimization
-
Completion Optimization
-
Environmental, Social & Governance
-
Development, Acquisition & Divestitures
-
Enhanced Oil Recovery
-
Admin
-
P#
- Getting Started with P#
- Data Cleansing
- String Functions
- Scenario Functions
- Regression Functions
- Placeholder Functions
- Neighborhood Functions
- Mathematical Functions
- Logic Functions
- Entities Function
- Moving Window Functions
- Time and Date Functions
- Statistical Functions
- Economic Functions
- Data Handling
- Additional Functions
- Directional Functions
- Machine Learning Functions
- DCA Functions
-
Packages
How do I create a new DCA?
The DCA function in PetroVisor allows users to easily create new curves for analysis.
To learn more about the overall functionality of the PetroVisor DCA Tool, see the Overview of DCA.
In PetroVisor, select "DCA" from the navigation panel on the left.
The user will see all current curves listed. On the top right of the screen, select "Add DCA."

The user will be prompted to select "Entity," "Rate Signal," and "Cumulative Signal."

The graph will display the selected entity and signals.
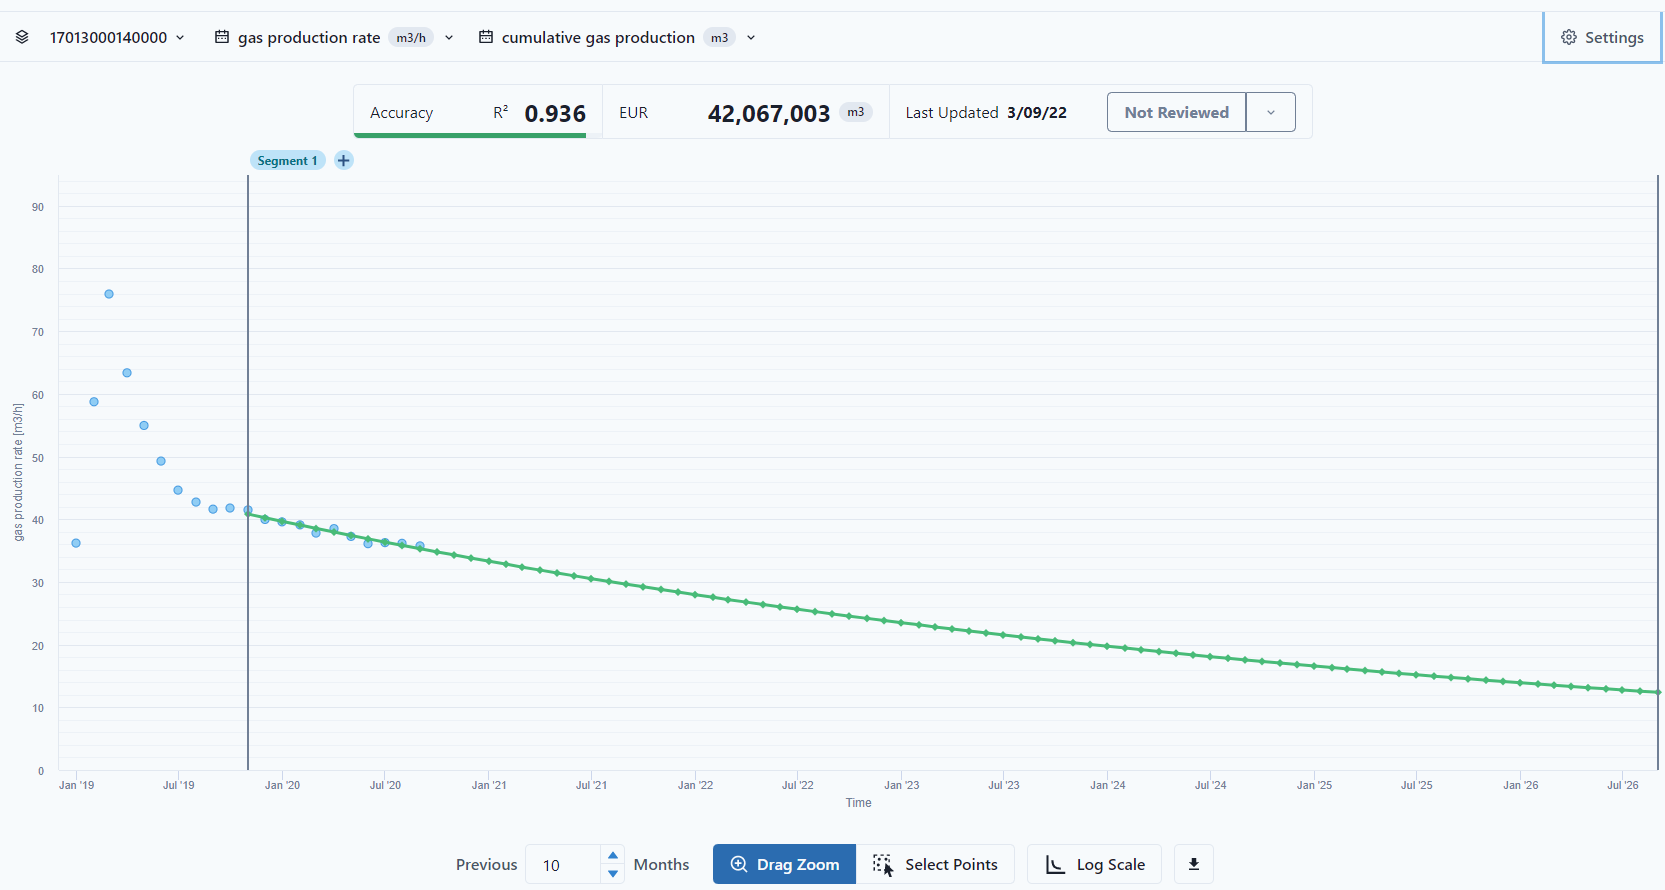
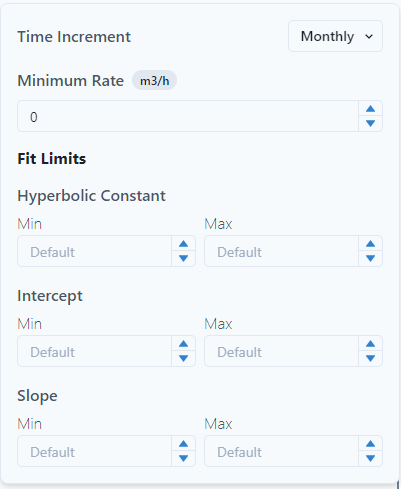
The user can also change settings by selecting the "Settings Gear" at the top right of the graph.
The user can either close out or select "Save" to save the graph. The graph will then stay in the DCA list. 