Workspace Documentation provides all the information for a specific Workspace.
To view Documentation, select the User Icon and click on
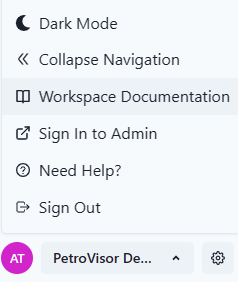
Documentation Home
All information impacting the entire workspace is documented at the home.
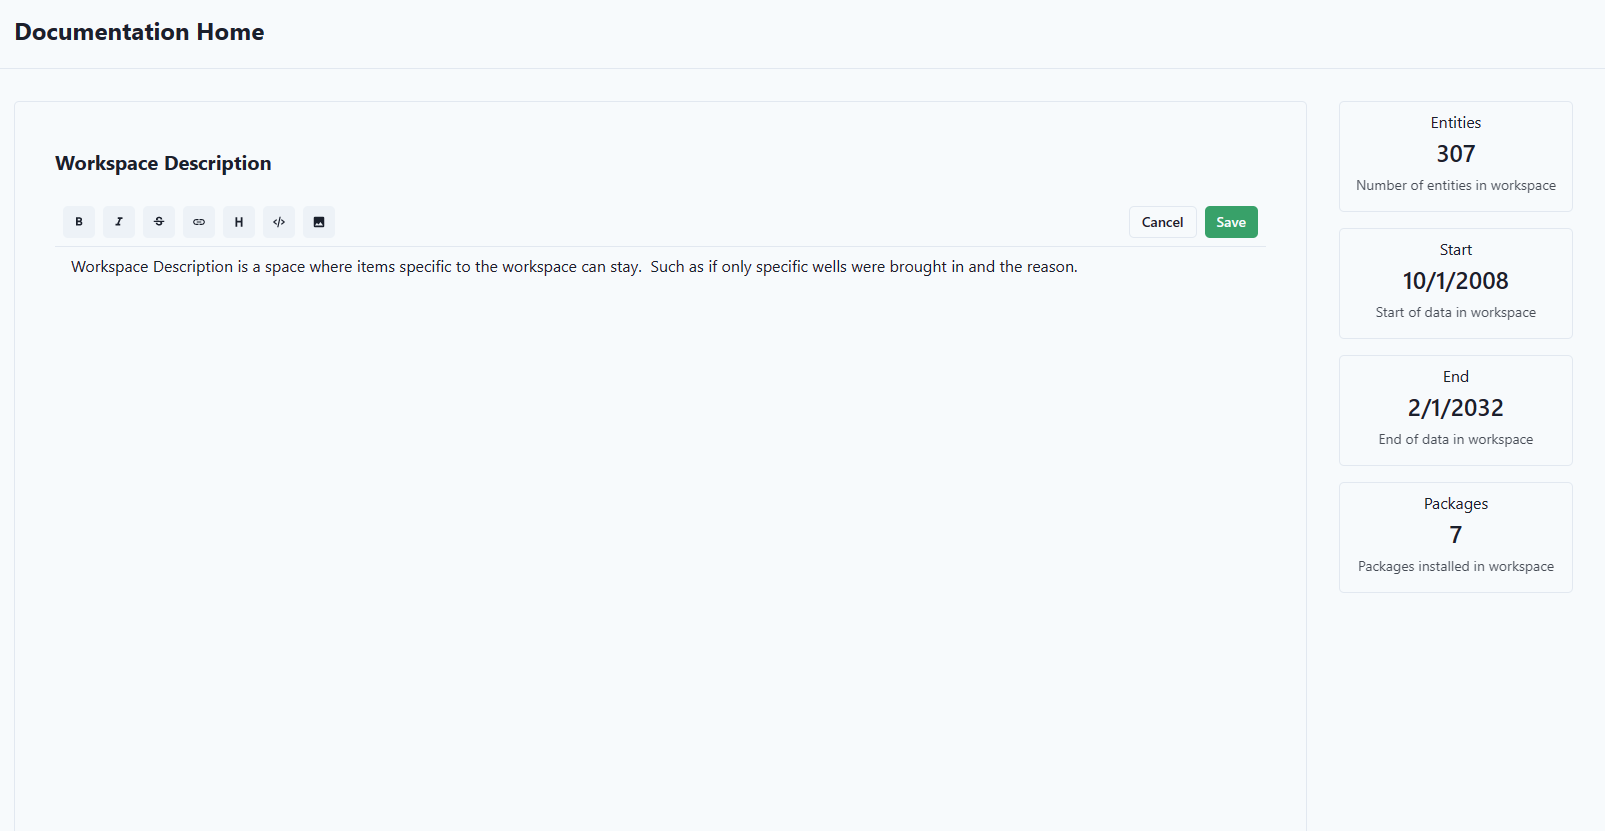
Workspace documentation allows users to create mermaid charts and line breaks. These features ensure that when editing markdown and pressing 'Enter' for a new line, the new line will be displayed in the rendered markdown after saving. This makes it easier for users to format and organize their documentation effectively.
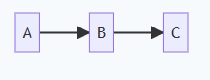
For an example, copy and paste the following in a description and hit "Save"
```mermaid
flowchart LR
A -->B
B-->C
```
It should display:
For more on mermaid charts, see this website: https://mermaid.js.org/syntax/examples.html
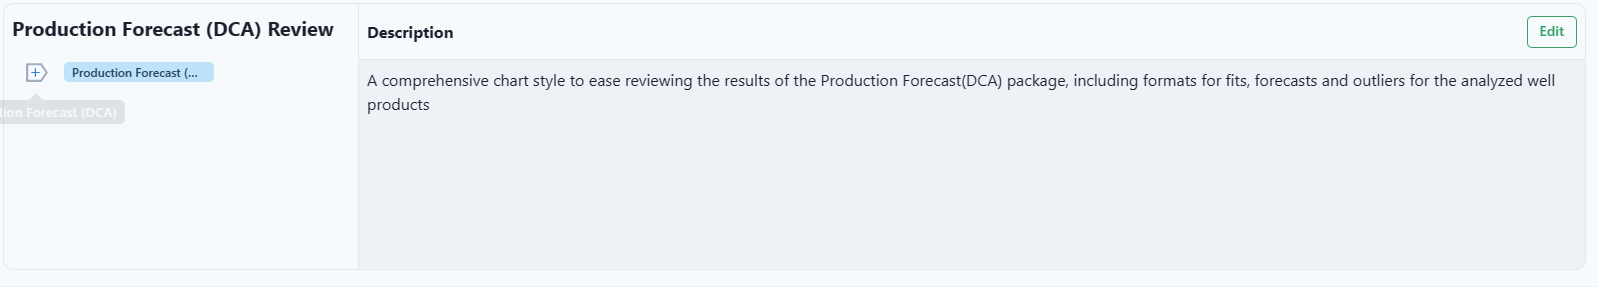
Chart Styles
Under the gear settings for charts, the platform has the ability to save specific styles for charts. These settings (how you view the chart) can be saved as Styles to view in different charts throughout the platform.
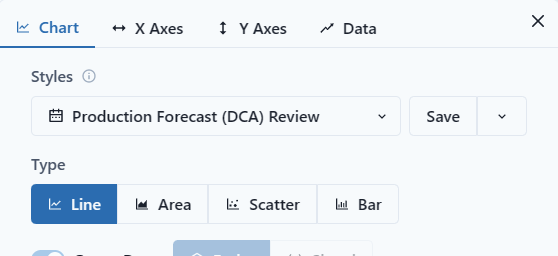
Documentation has the description of those charts.
Cleansing Scripts
Scripts written to fix data. For instance, change Null into a 0.
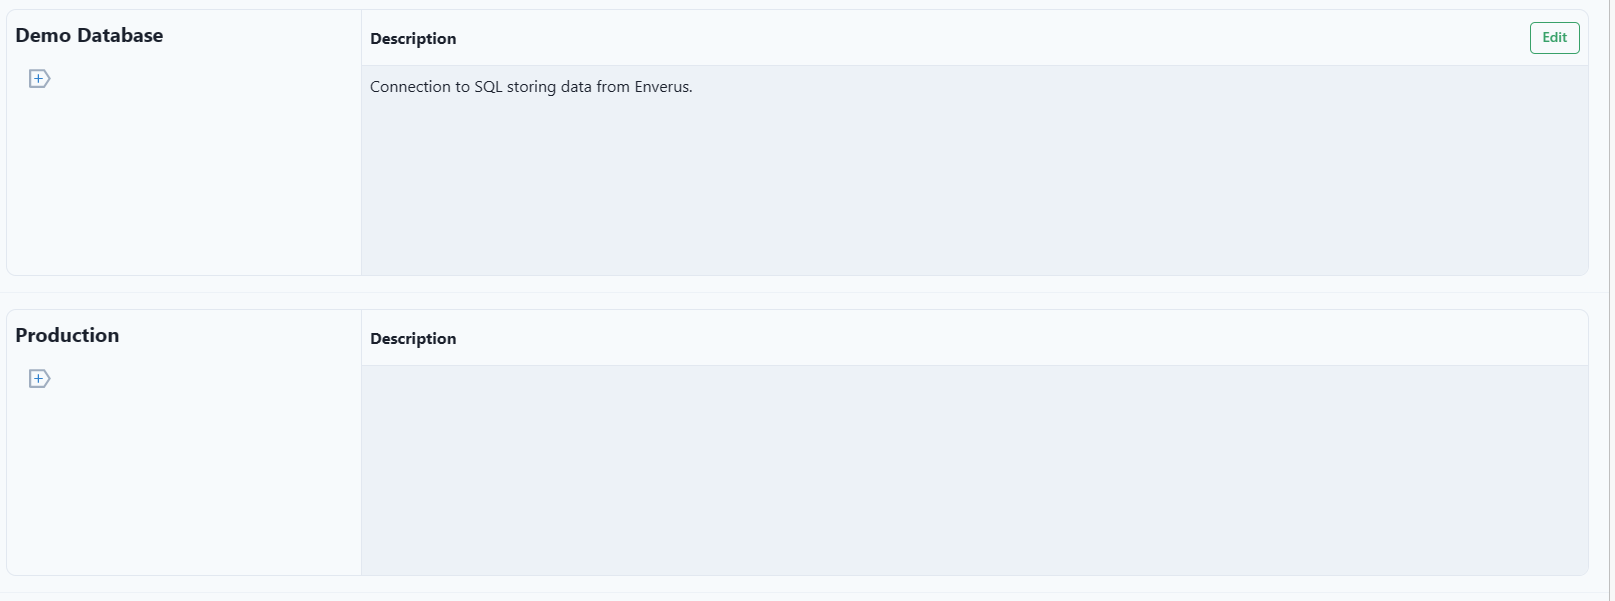
Connections
Connections are where PetroVisor connects to data, like an excel file or Petrel.
Document sources where data is brought into the platform.
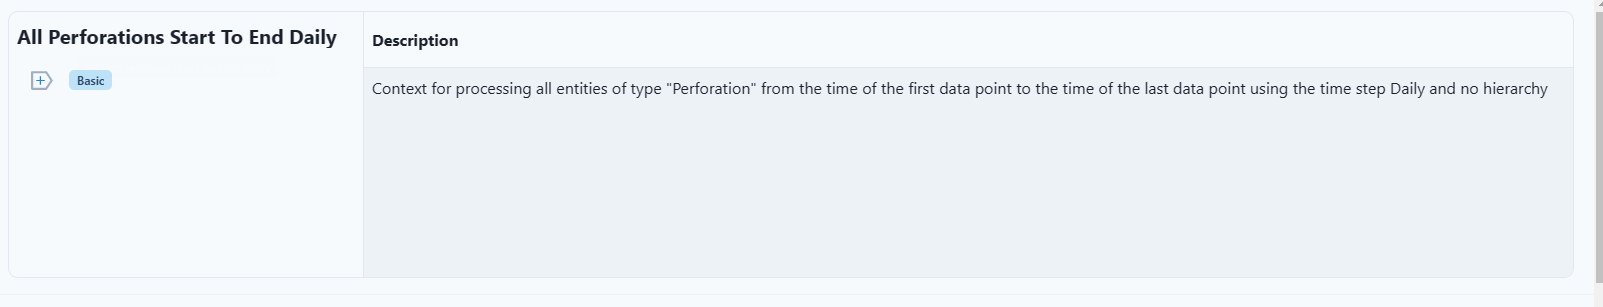
Contexts
Contexts are a combination of an Entity Set and a Scope.
Provides labels and descriptions.
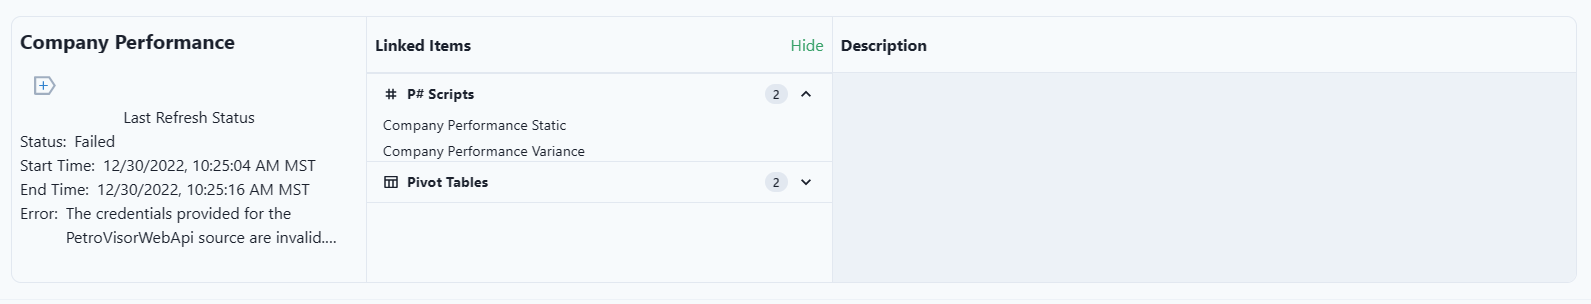
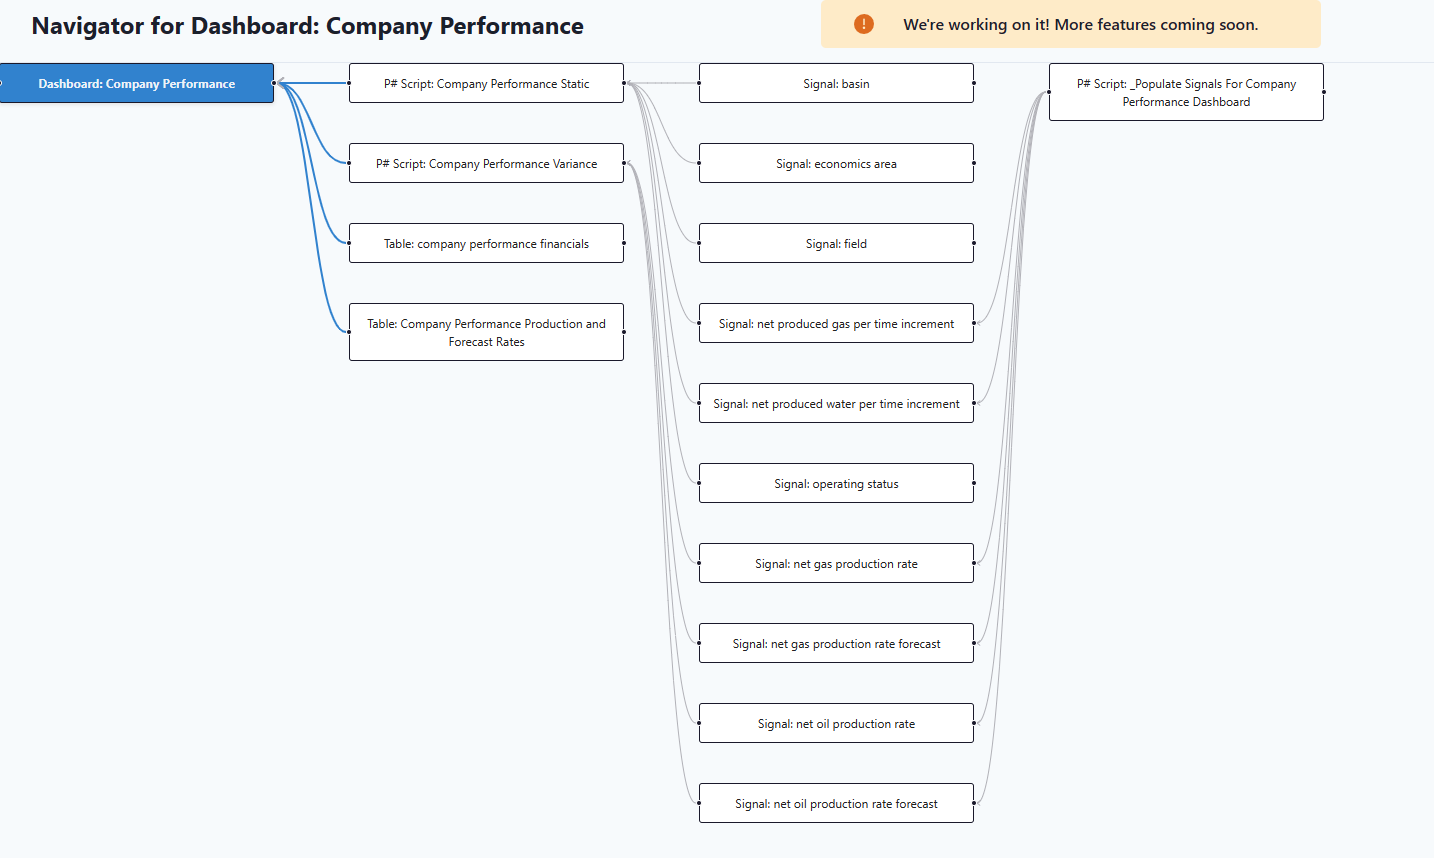
Dashboards
And the Navigator
Data Integration Sets
Data Integrations are automations from data sources into PetroVisor.
Provides labels and descriptions for the set.
Data Sources
Sources are data connections broken down by the type of entities they contain, like financial data over a time period.
Provides labels and descriptions for each source.
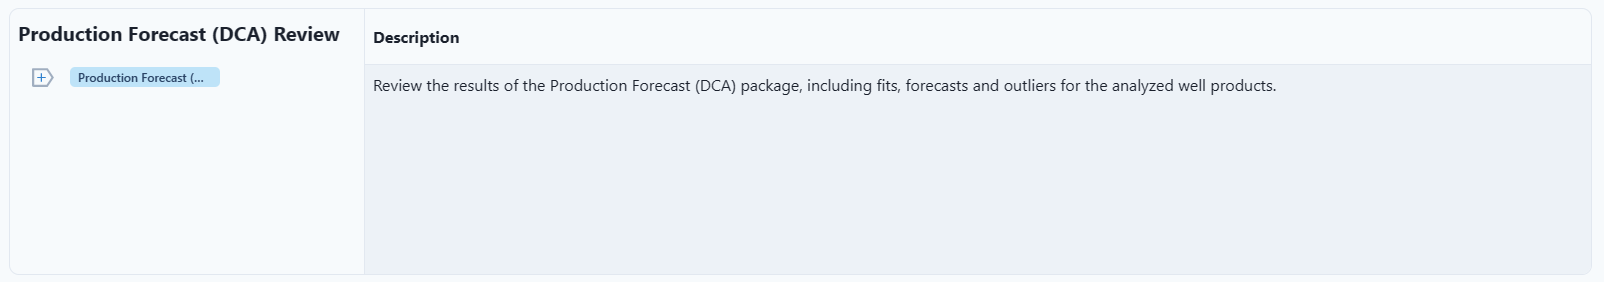
DCAs
Each Decline Curve Analysis can have labels and descriptions.
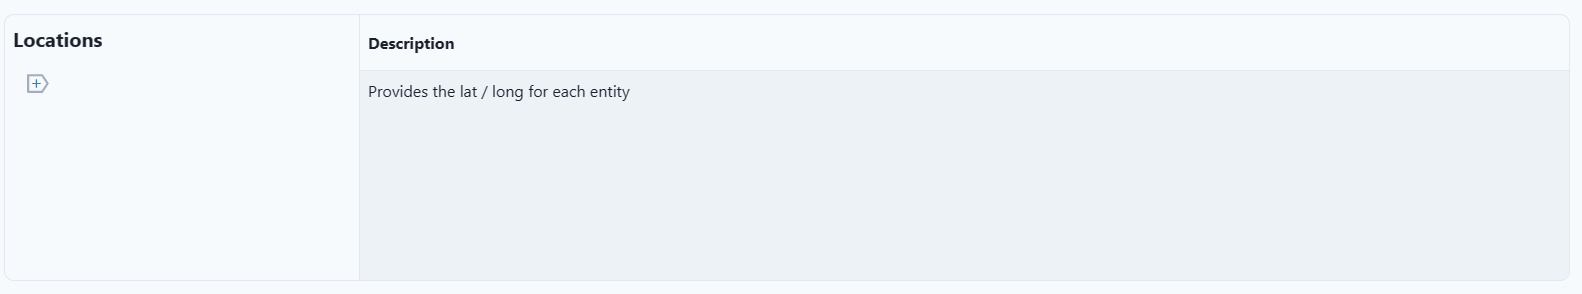
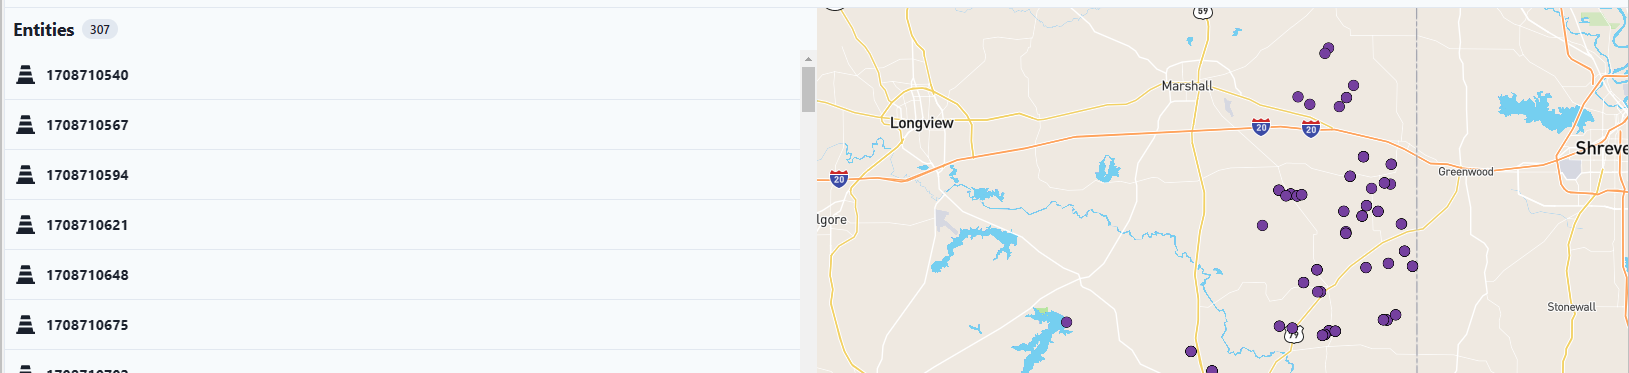
Entities
Provides a list and map location for each Entity.
Entity Sets
Provides a label and description for each Entity Set.
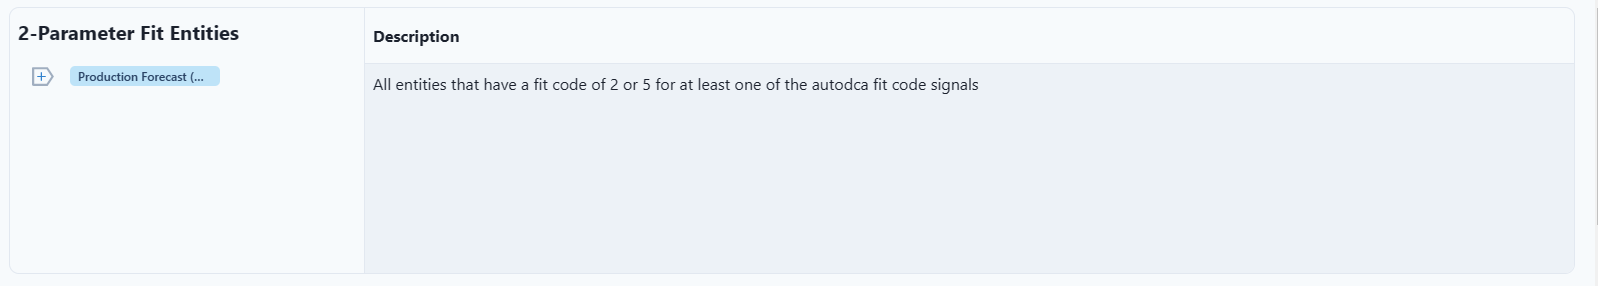
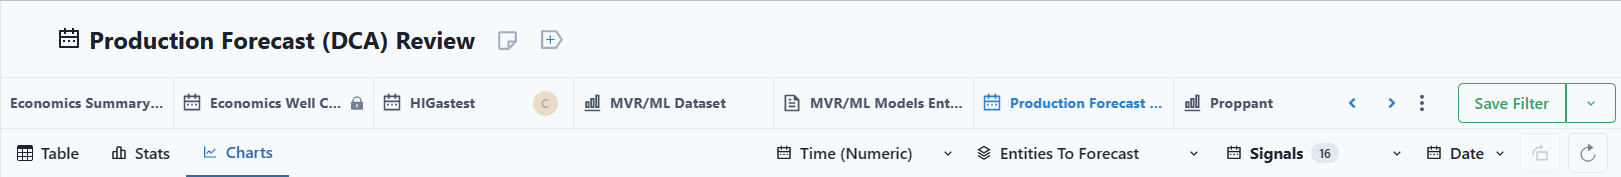
Filters
Filters are an easy way to quickly view data.
Provides labels and descriptions for each Filter under the Data tab.
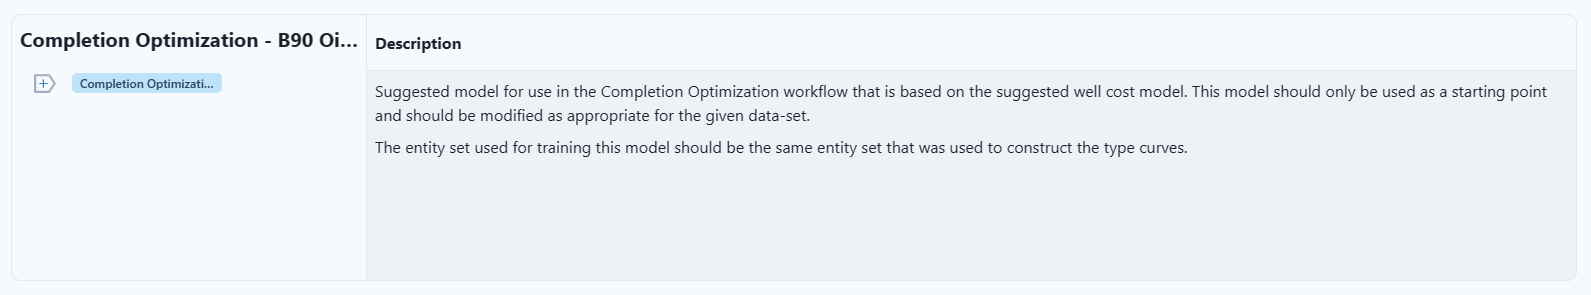
ML Models
Provides labels and descriptions for each model.
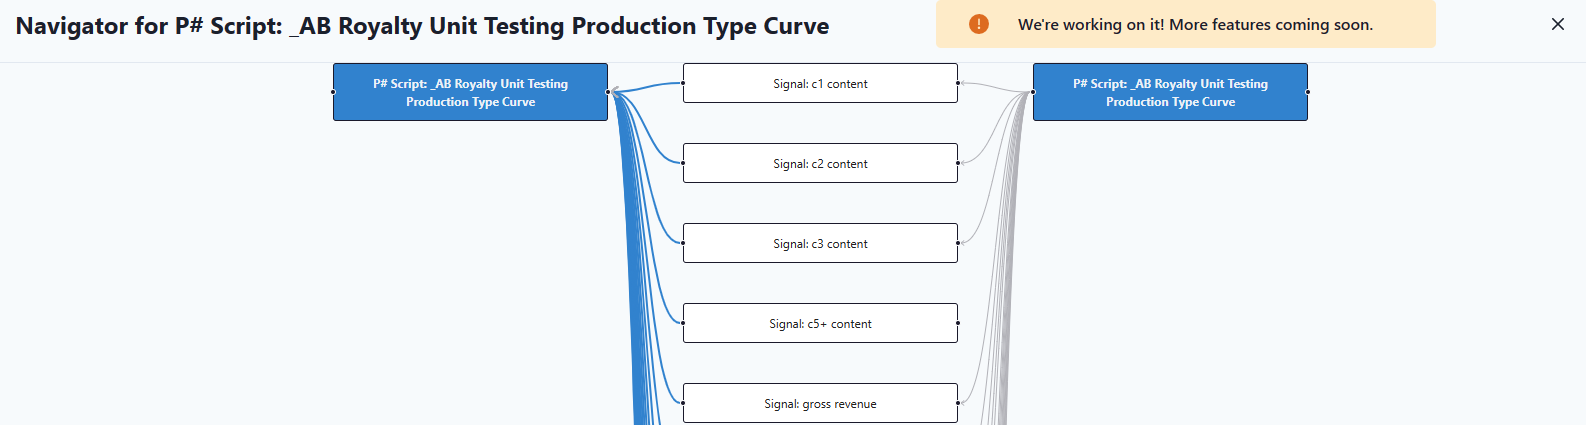
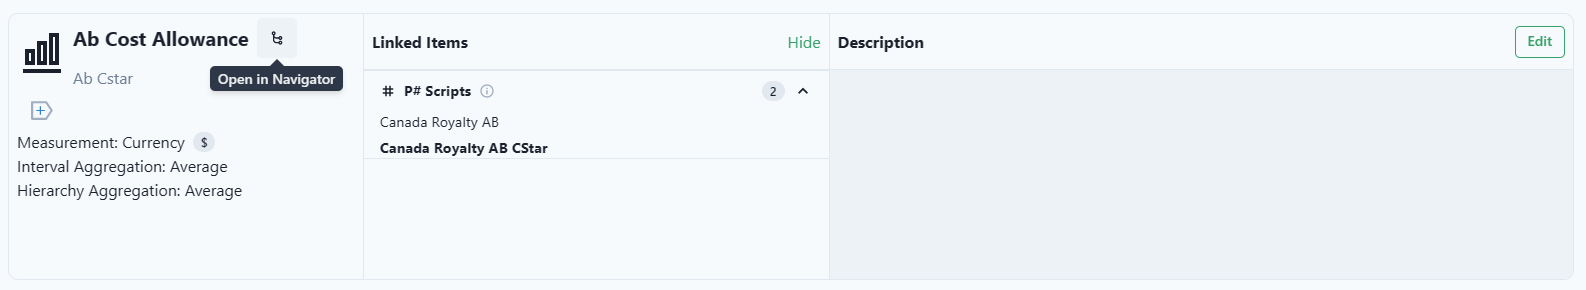
P# Scripts
Provides labels, date stamp, Entity Set, Scope, Input and Ouput Signals, and a description.
Also provides a navigator link.
R Activities
Provides labels and description associated with each R Activity.
Reference Tables
Provides labels and description associated with each Reference Table.
Rules
Rules create tags for Entities. For example, a Rule occurs at an event of a well, such as Active.
Scopes
Provides labels and description associated with each Scope.
Script Tables
Script tables are for code that can be used again. For example, a P# script can reference that table and bring in that information. Script Tables are found in the Library.
Provides labels and description associated with each table.
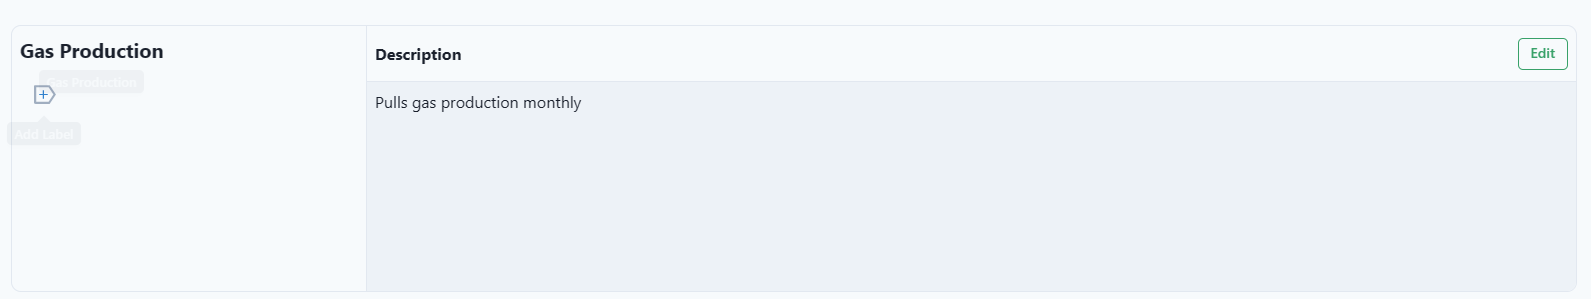
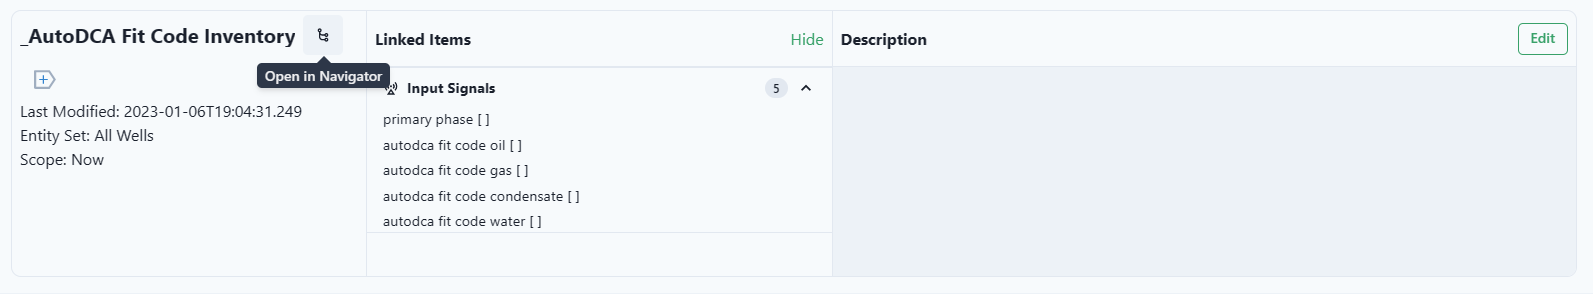
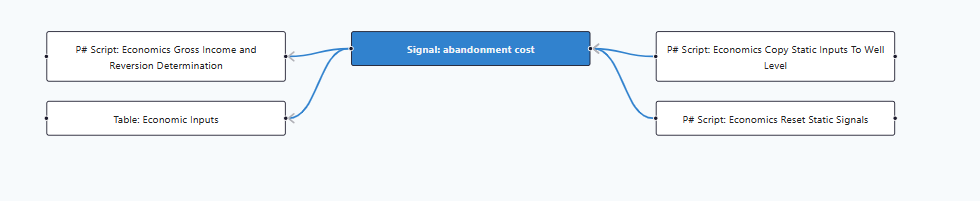
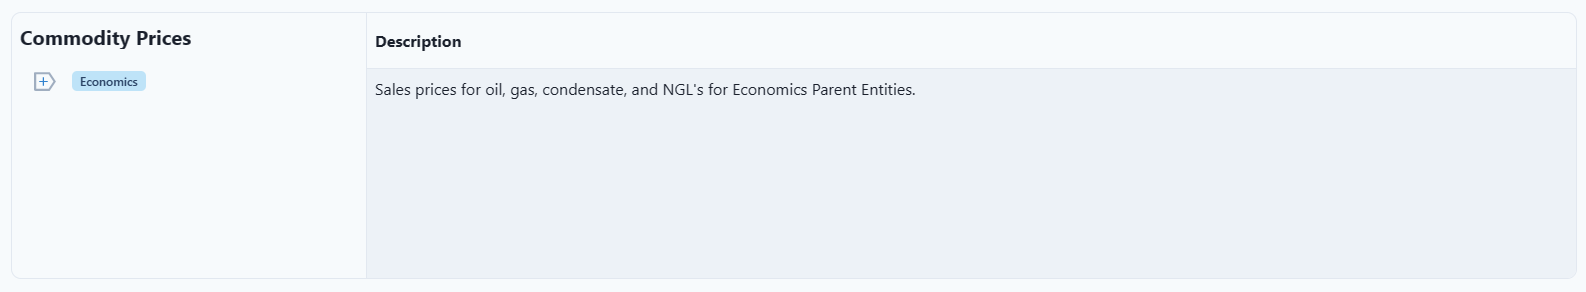
Signals
Provides labels, linked items, and descriptions associated with each signal.
Also provides a link to the Navigator.
Tables
Provides labels and descriptions associated with each Table.
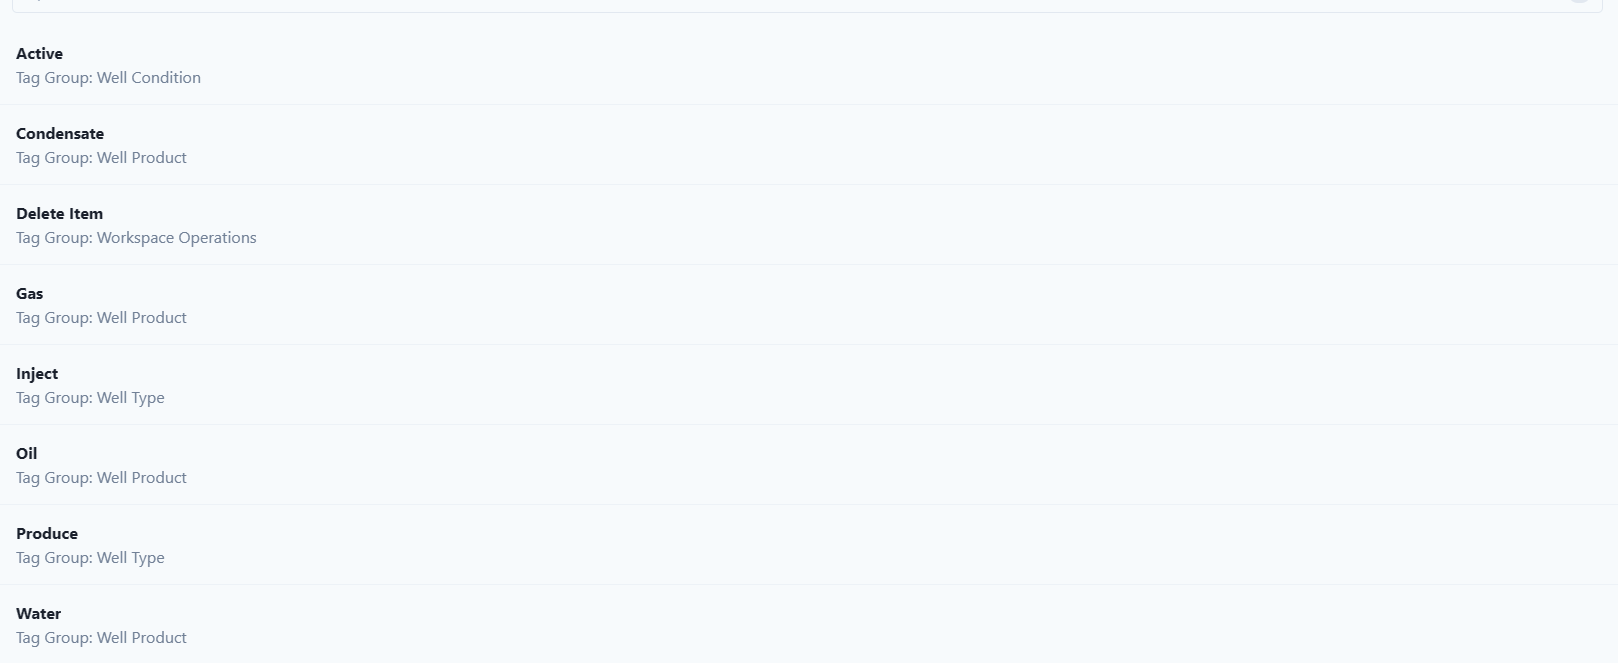
Tags
Tags are classified events for a given entity
Lists all tags in the workspace.
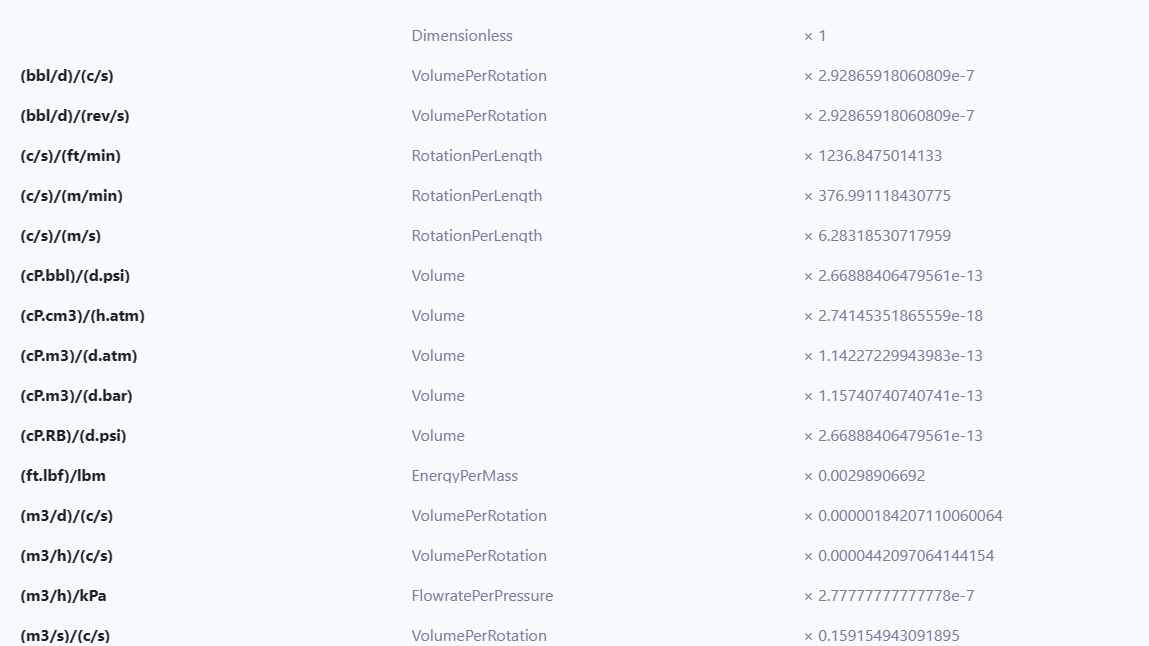
Units
Units are associated with a signal.
Listing of all units used in the Workspace.
Workflow Schedules
Provides labels and descriptions associated with each Schedule.
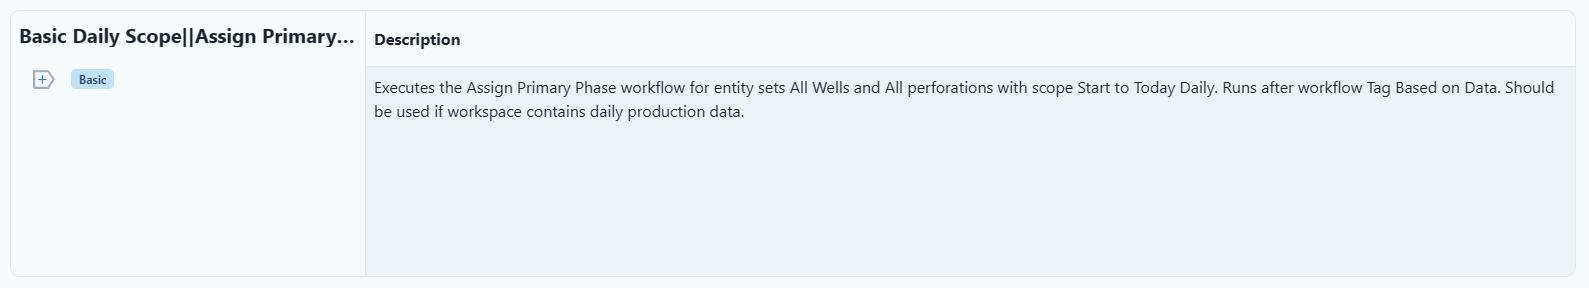
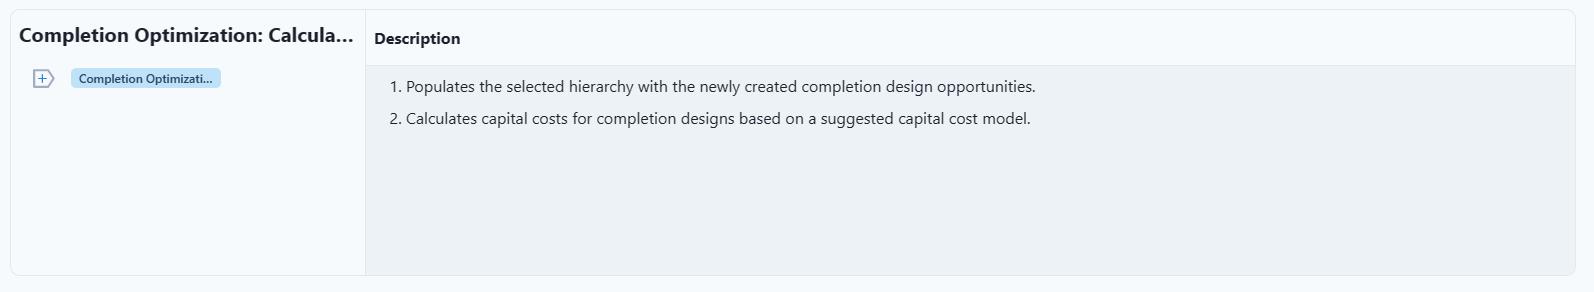
Workflows
Provides labels and descriptions associated with each Workflow.
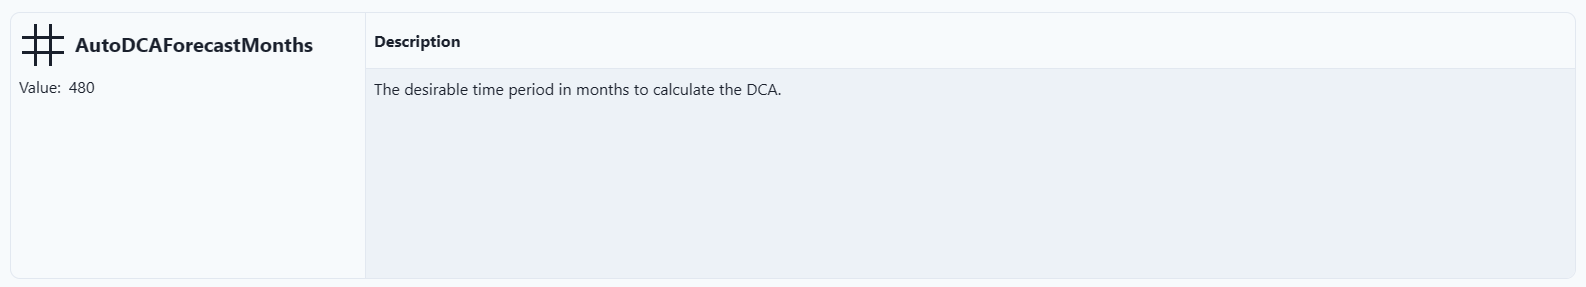
Workspace Values
Workspace Values are constants that are used throughout the Workspace.
Provides the constant and a description for each value.