- Datagration Knowledge Base
- Completion Optimization
- Completion Optimization Dashboards
-
Getting Started
-
Customer Training
-
Customer Success
-
Updates
-
Production Optimization
-
Completion Optimization
-
Environmental, Social & Governance
-
Development, Acquisition & Divestitures
-
Enhanced Oil Recovery
-
Admin
-
P#
- Getting Started with P#
- Data Cleansing
- String Functions
- Scenario Functions
- Regression Functions
- Placeholder Functions
- Neighborhood Functions
- Mathematical Functions
- Logic Functions
- Entities Function
- Moving Window Functions
- Time and Date Functions
- Statistical Functions
- Economic Functions
- Data Handling
- Additional Functions
- Directional Functions
- Machine Learning Functions
- DCA Functions
-
Packages
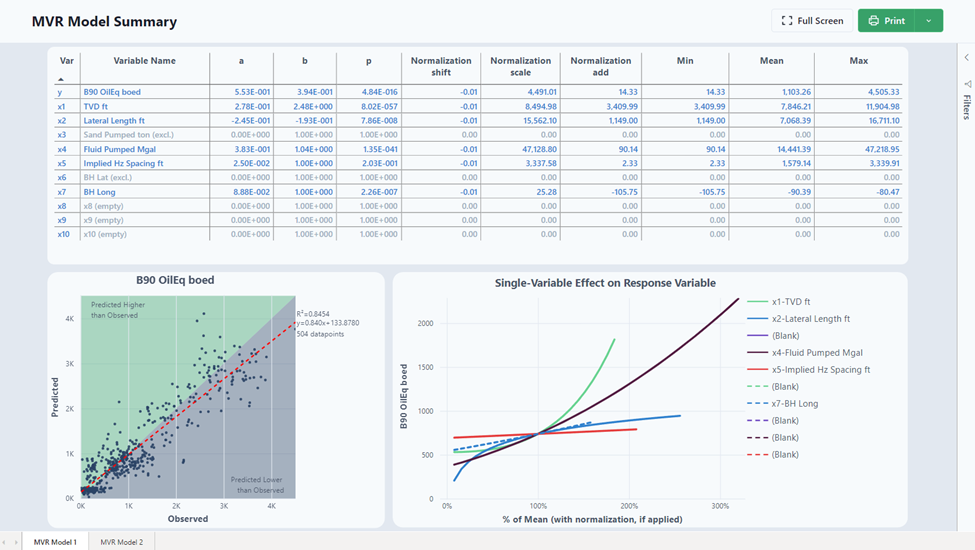
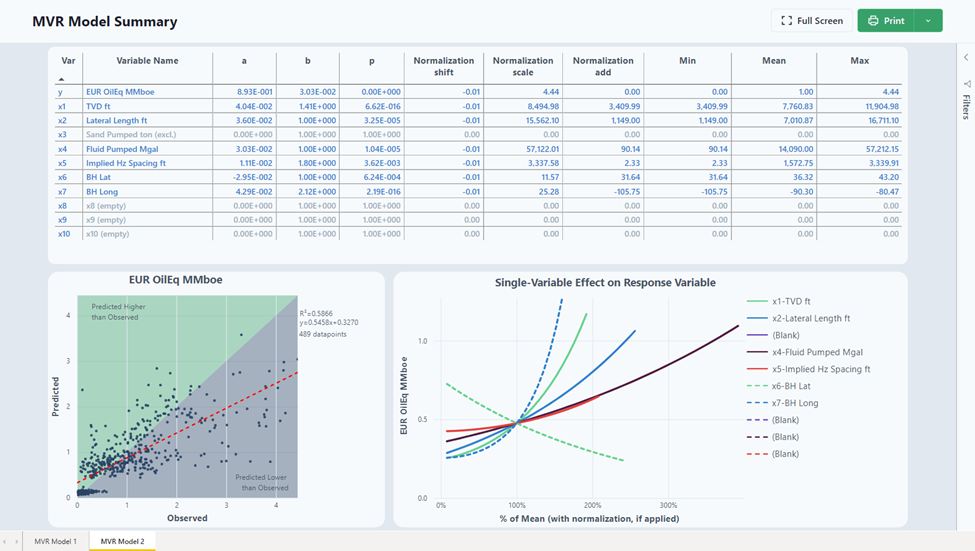
MVR Model Summary Dashboard
The MVR Model Summary dashboard report comprises two pages of graphs and tables that visualize the results of the MVR model workflow.
Link to download the MVR Model PowerBI Template (no data) file.
Link to MVR Package Description.
The report has one page for each model with the same visual elements on each. Each page has a table of the variable names that were chosen for the model, their coefficients, normalization factors, and descriptive statistics (min, mean and max). There are two graphs, one showing the observed y (response variable) vs predicted y, the other showing single-variable effect of each of the independent variables on the response variable.
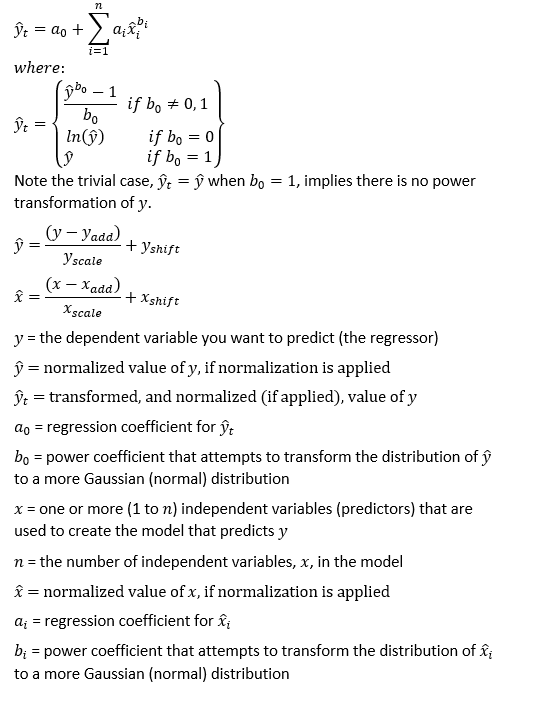
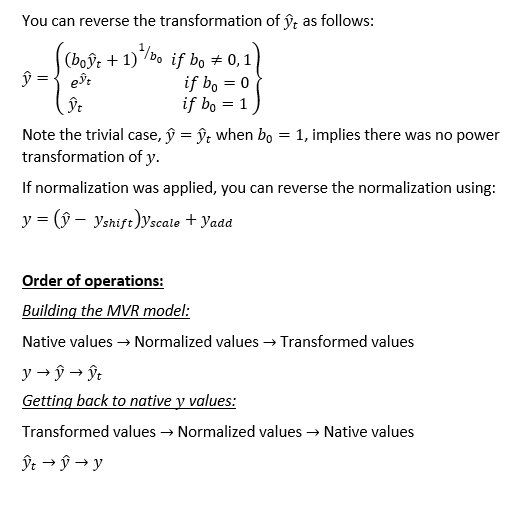
MVR Equation
The generalized form of the Multi-Variable Linear Regression (MVR) equation is