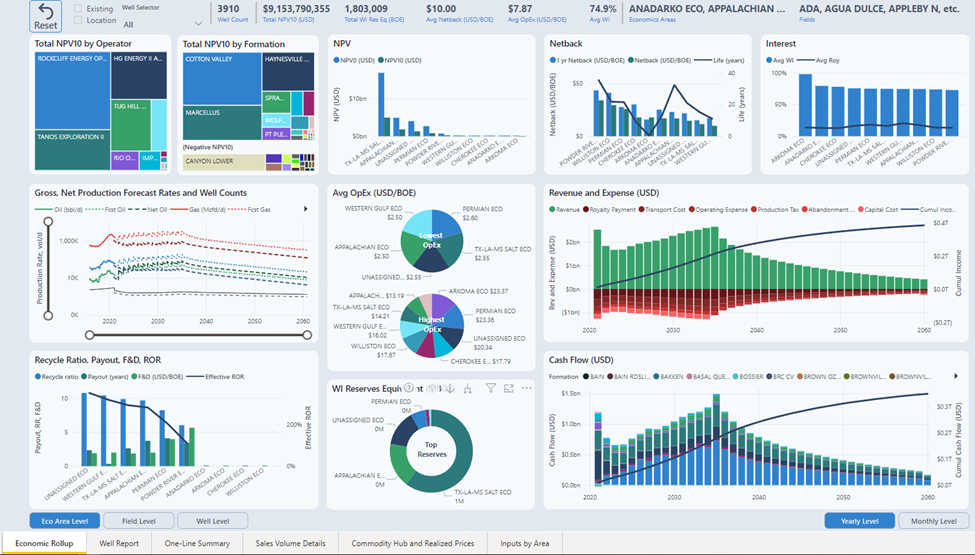
The Economics dashboard consists of six pages that visualize the inputs and outputs of the Economics Package.
The first four pages have economic details to the Well level and reflect the output results, the last two have details to the Economics Area level and define many of the inputs to the workflow.
Link to article defining the Economics Package.
Navigate to Dashboard
In PetroVisor, Select "Dashboard" and scroll through the list and select the "Economics Summary" Dashboard.
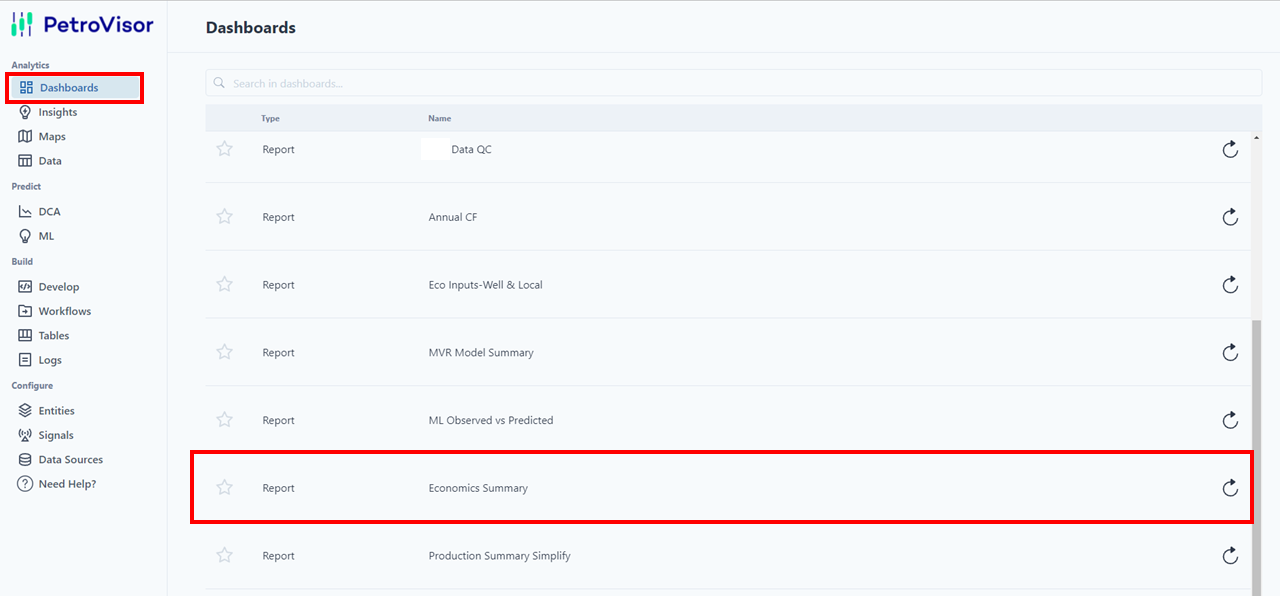
After selecting, the dashboard will display with multiple tabs at the bottom to show additional pages.
The six (6) pages included in the Economics Summary are:
- Economic Rollup
- Well Report
- One-Line Summary
- Sales Volume Details
- Commodity Hub and Realized Prices
- Inputs by Area
Basis Report Features
All of the report pages have a refresh icon  in the upper left corner. This icon will reset all filters and hierarchy levels to the initial default state of the page.
The first four report pages have a well count that will reflect all filters in effect.
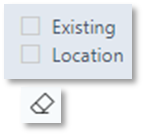
Some report pages have slicers which are check boxes or dropdown lists to provide convenience for commonly used filters. These filters remain on until they are toggled off, the reset icon is selected, or the eraser symbol in upper right of slicer is clicked. To select more than one item in the slicer hold the CTRL key down while selecting.
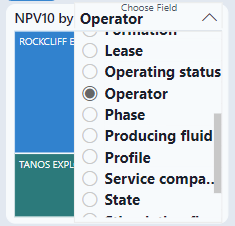
On the Rollup page, the two NPV10 visuals are grouped by Operator and Formation by default. These groups my be customized by clicking the drop-down icon in the title and selecting another available field. Reseting the page will set them back to the default groups.
Some report pages have “Action” buttons that will change the report view or take you to another report page.
If you hover over them they will provide a brief comment on what action they perform.
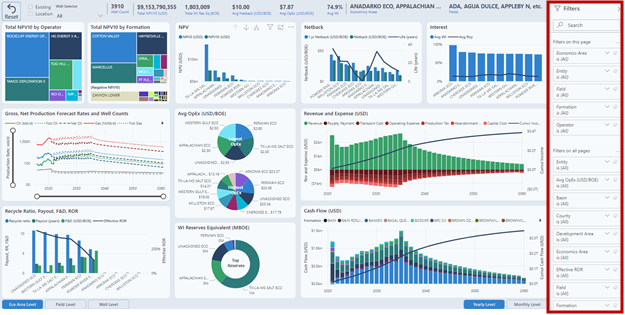
Filters
There are a few ways that data is filtered on reports. Slicers as noted above, filters on the right-side panel (shown below) and ‘select’ filters. Slicers and side panel filters will remain in effect until removed with the reset icon or the eraser symbol even if you leave the page. ‘Select’ filters occur when you select an item within a visual to temporarily filter or highlight the other visuals on the page with related data. To remove the select filter you may re-select the same item, select on the background, or select the refresh icon. Select filters are not retained if you leave the page.
Drilldown
Many of the visuals have built in hierarchies that enable data to be summarized at the highest level or drilled down to details at the lowest. By default the hierarchy levels on page one are Economics Area (Level 1), Field (Level 2) and Well. There are a few methods to access the drilldown functions within the report. Action buttons are provided to sync drilldown of all hierarchy visuals on the page to the same level. The Level 1 and Level 2 hierarchy fields may be customized by selecting the drop-down icon on the Level buttons. Resetting the page will put them back to the default fields. 
The time visuals follow a hierarchy of Yearly and Monthly.

Drilldown actions may also be accessed through the right click menu or icons above each visual.
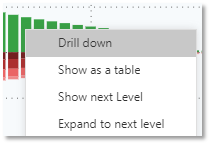 Using this method will only drill down the specific visual but will still filter/highlight other visuals with related data if items are selected.

Drill Through Reports
Drill through reports are a convenient way to pass filtered data from one report page to another. There are a few ways drill through reports may be accessed. 
If you are selected on an item in the Rollup page the Action buttons for one or more of the other report pages become selectable. Click the button of the desired report.
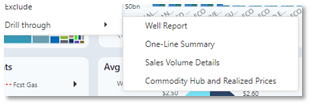 If you hover over or select an item on a visual right click to get a menu. Available reports are listed in the Drill through sub menu.
If you hover over or select an item to show the tooltip, the drill through option will show on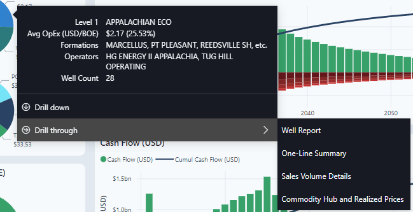 the tooltip after a moment. Available reports are listed in the Drill through sub menu.
Drill through reports are available from any of the four output report pages by using the right click or tooltip menu methods.
Important* When you drill through to another report page, the item you hover over or select on plus all active filters of the source report page become the filters for the landing report page. You must reset the landing page to remove them or open the filter pane to adjust them.
In the Economics Summary, there are six (6) pages.
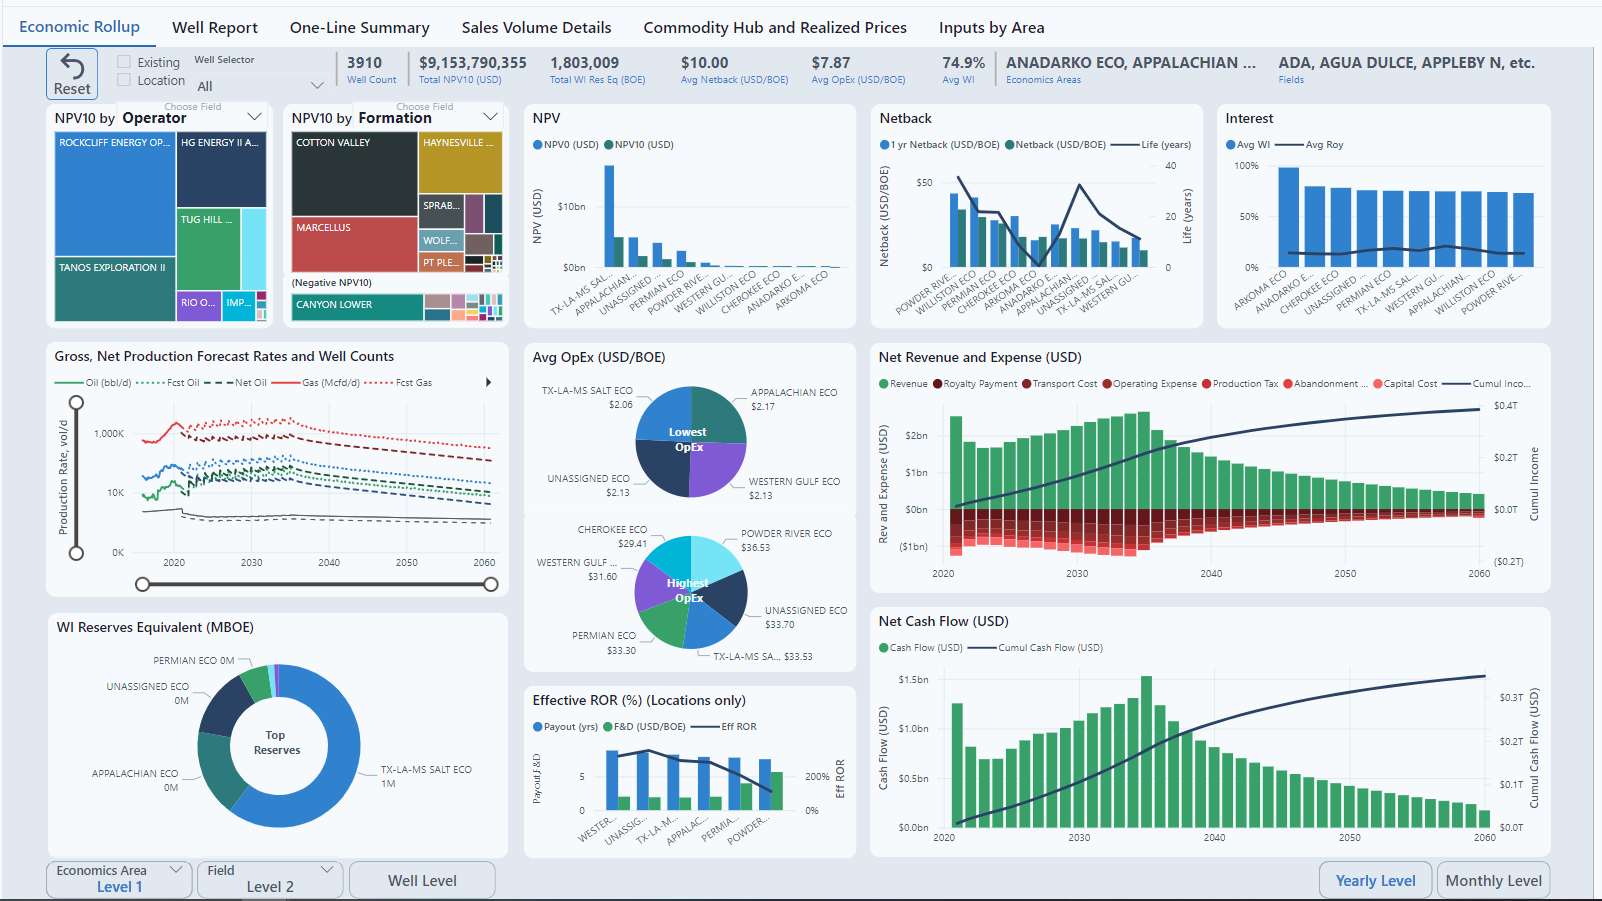
Economics Rollup
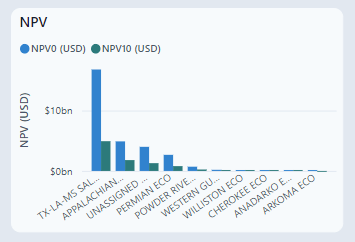
NPV
Net Present Value is calculated by well.

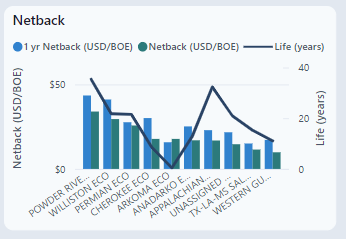
Netback
This graph displays the total profit per barrel.
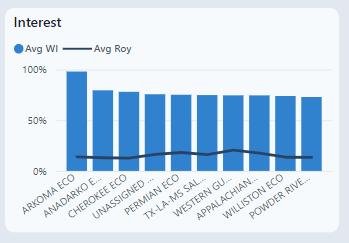
Interest
Working Interest (WI) is a percent of share of the costs and expenses of operating a well. Because WI can change over time, it is displayed as average WI. Since WI is not a share of the revenue, average royalty displays the average royalty paid.
Gross, Net Production Forecast Rates and Well Counts
The production data comes from the client production data. The forecast can be pulled from either the client's analysis or from Datagration Decline Curve Analysis. The time slicer at the bottom can filter to a specific time period.

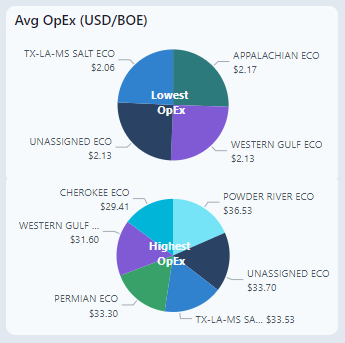
Avg OpEx (USD/BOE)4
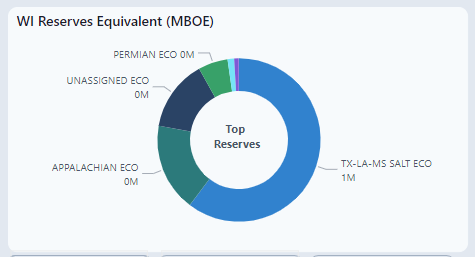
WI Reserves Equivalent (MBOE)
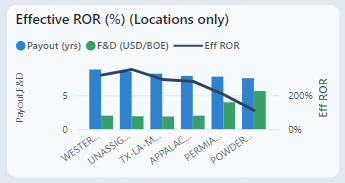
Effective ROR (%) (Locations only)
In PetroVisor, cash flow is calculated monthly. The Effective Rate of Return (ROR) is the IRR “converted” to an annual rate:
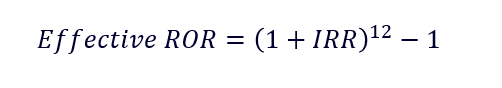
If the IRR is undefined, the Effective ROR is also undefined.
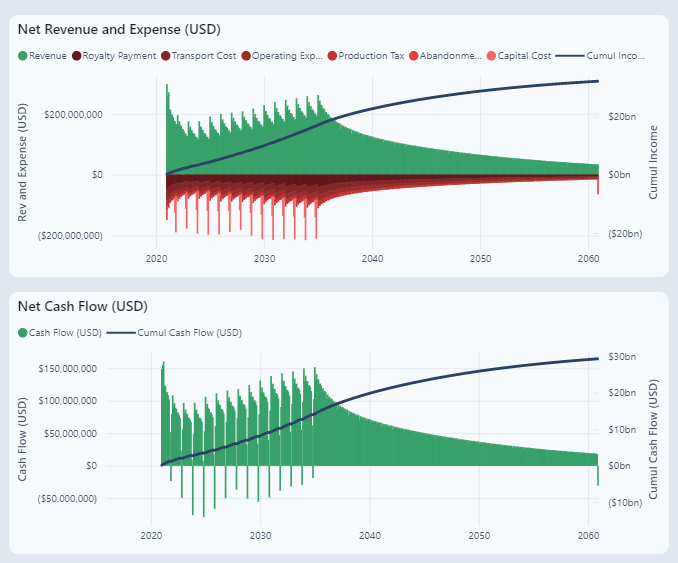
Net Revenue and Expense (USD)
This graph shows the expenses and revenue to visualize the Cumulative Income.
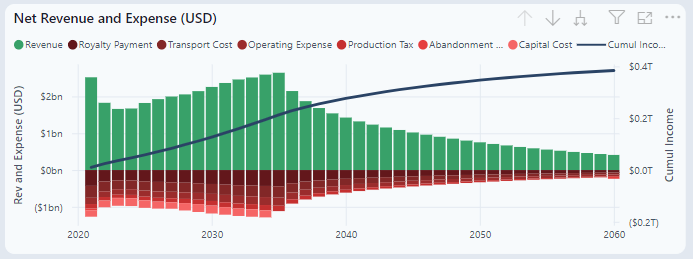
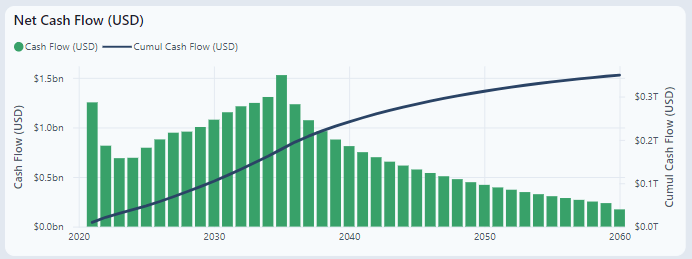
Net Cash Flow (USD)
Similar to the graph above, this graph shows the cash flow.
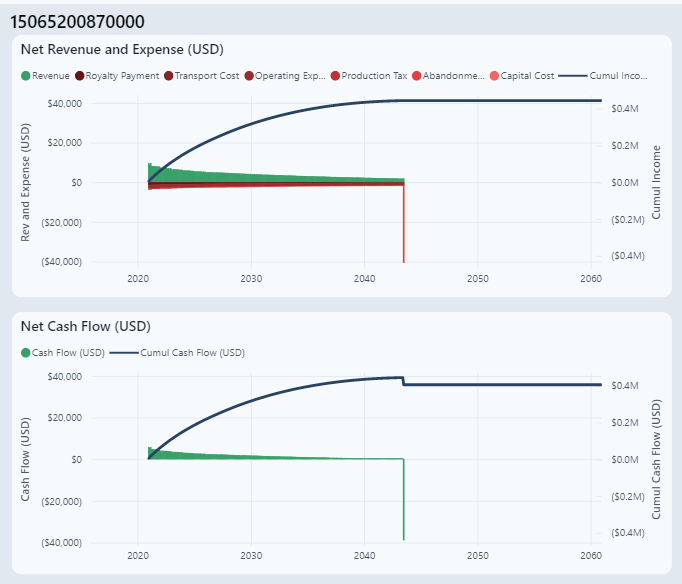
Well Report
This dashboard does a deeper dive into a single well economics.
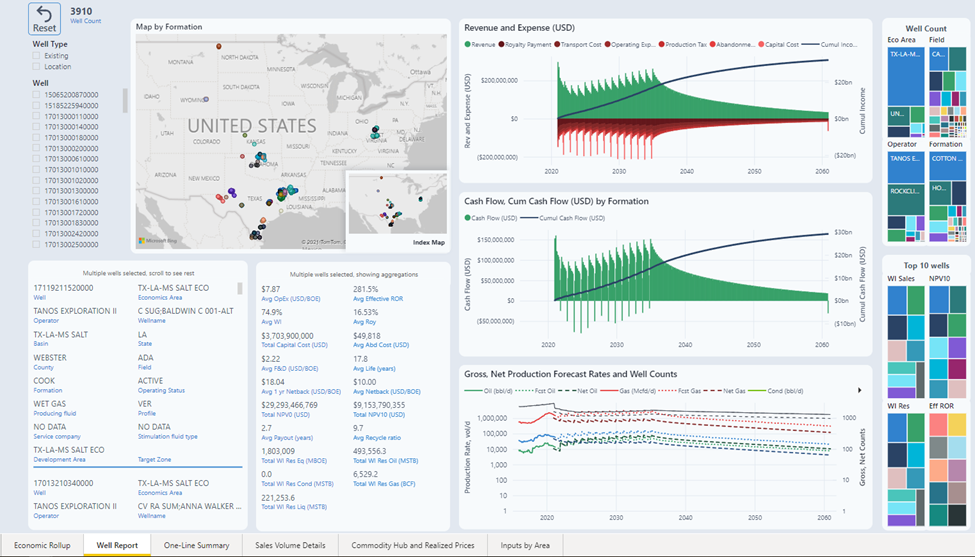
Revenue and Expense, Cash Flow
A more in-depth view of well cash flow. These charts display spikes when wells come online. You can see the spike in Revenue but also the spike in the cost to bring the well online.
Sorting these graphs to a single well will display the economic limit of the well, where the well "drops off." The red line is the abandonment costs.
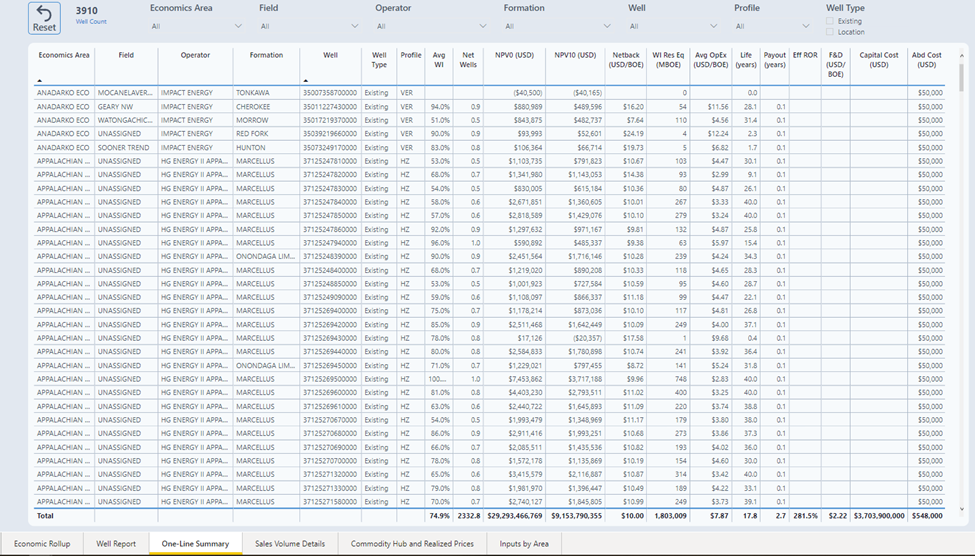
One-Line Summary
Summary values for every single well. This displays all the output of the Datagration workflows.
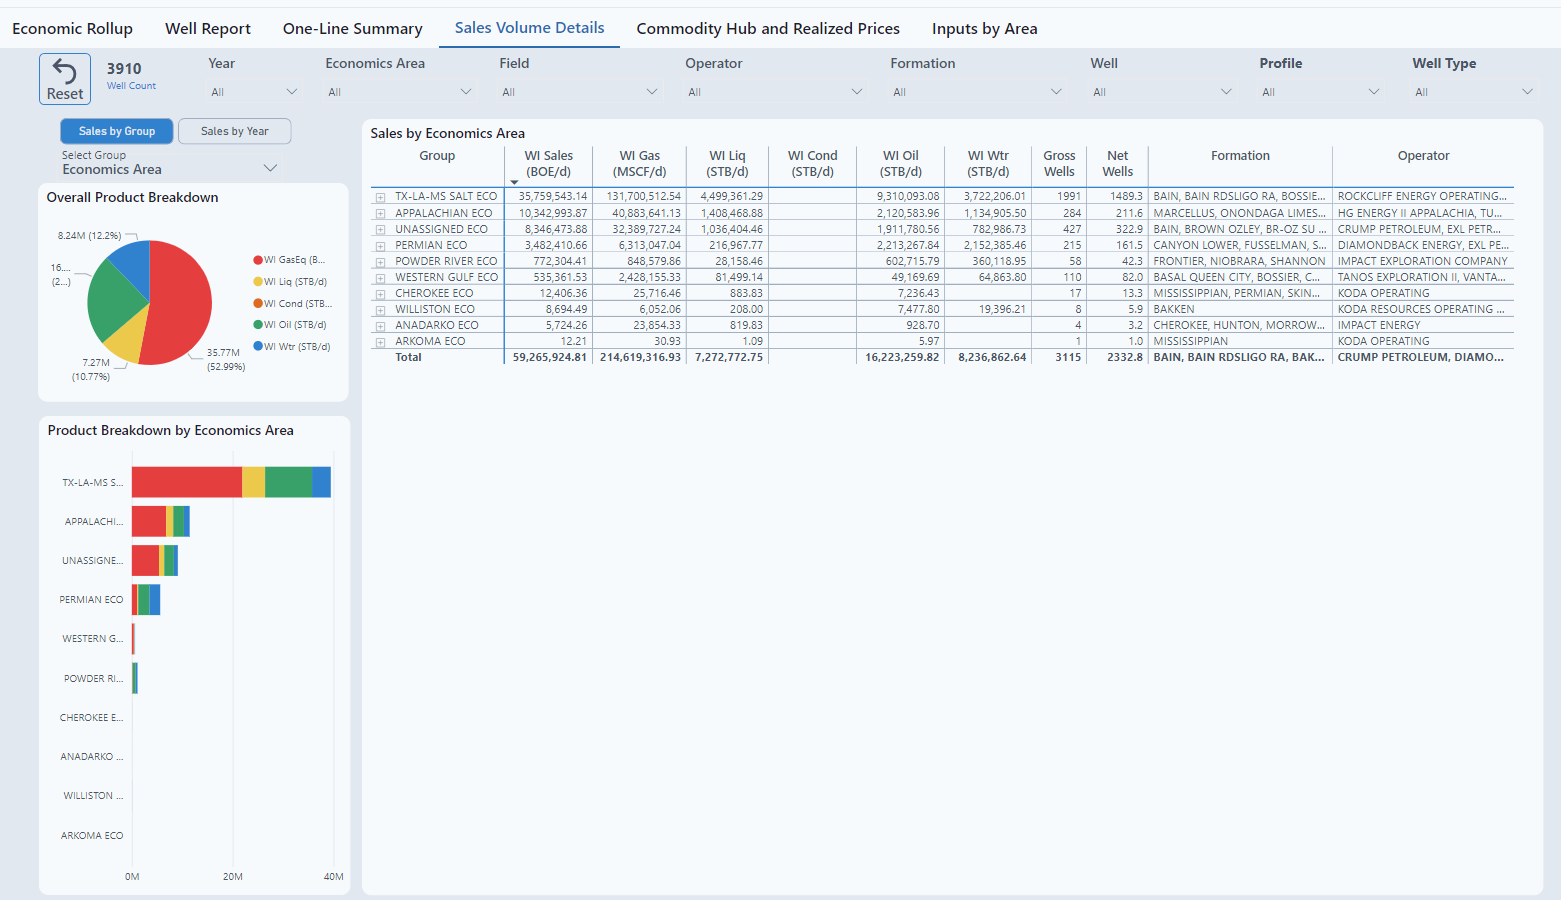
Sales Value Details
Sales can be visualized by Group or by Year.
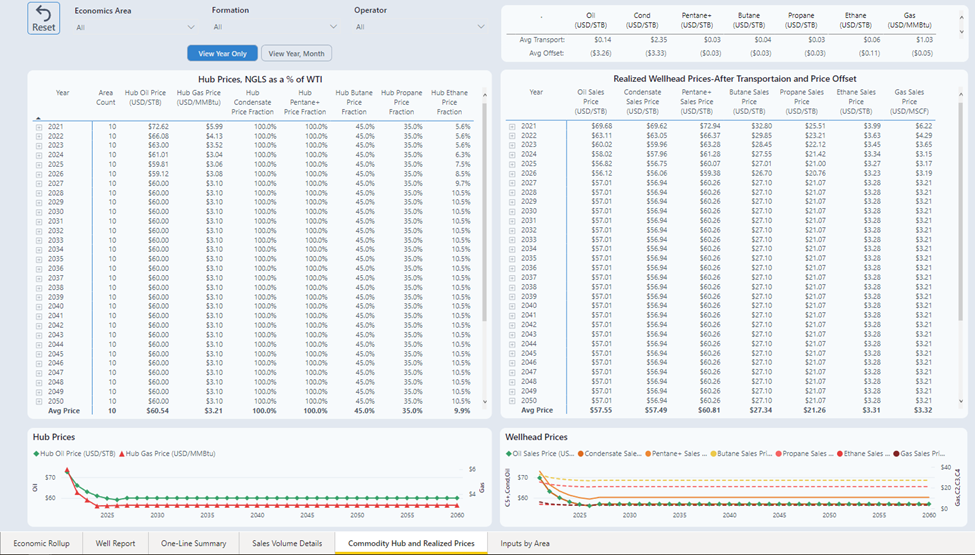
Commodity Hub and Realized Prices
Prices viewed by Year or by Month.
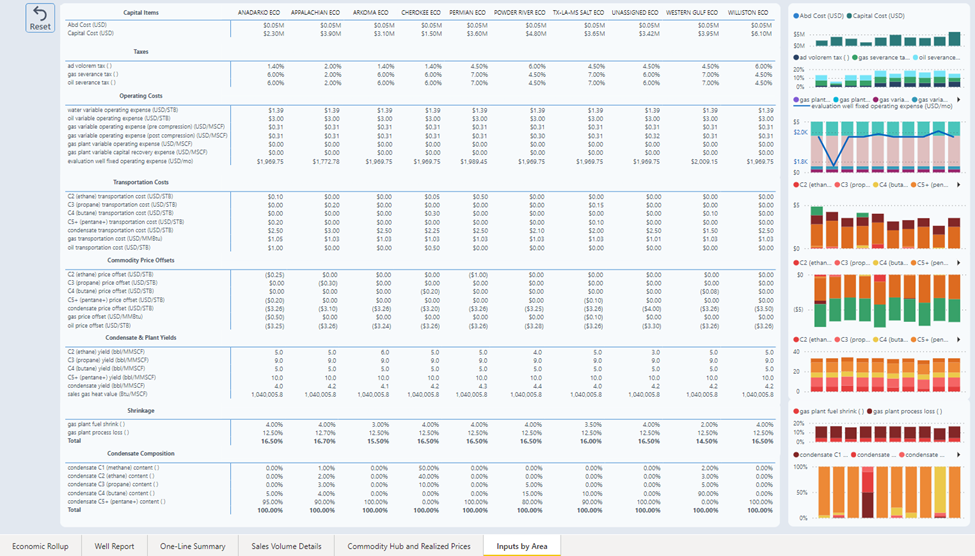
Inputs by Area
Displays the saved inputs. To update the values, the user must put the inputs into the Data section and rerun the Economics Workflows.