
The Completion Optimization workflow steps and required skill sets.
What is the Completion Optimization Workflow?
The PetroVisor Completion Optimization workflow consists of eight automated main components designed to guide key business decisions related to completion designs. The workflow steps are carried out sequentially, as illustrated below. Users select configurations for each step to customize it according to their specific requirements.

What skills are needed to conduct Completion Optimization in PetroVisor?
The Completion Optimization workflow does require the user to make choices along the workflow. The choices do require some knowledge in these areas:
- Production Forecasting: Understand the Arp's hyperbolic equation, exponential tail declines, and Estimated Ultimate Recovery.
- Completion Designs: Ability to source and QC completion parameters such as completed lateral length, stages, perf clusters, proppant and frac fluid volumes, injection rate, identify various completion technologies (plug and perf, open-hole sleeve, etc.), and distinguish between various fracture fluid systems.
- Development Parameters: Wells per pad, well spacing.
- Geology: Porosity, net pay, water saturation, permeability, and zone tops in relation to landing/completion zone.
- Machine Learning: The ML module has considerable domain expertise embedded in default values, however the user will benefit by knowing several basic concepts such as parameter transformations, outlier detection and removal, correlation coefficient, p-value, confidence level, Variance Inflation Factor (collinearity), over-fitting indications, feature importance, and identification of interpolation/extrapolation conditions.
- Economics:
- Well Costs as functions of TVD, lateral length, fracture stages, proppant and fracture fluid volumes, perf clusters, MOB/De-MOB costs for drilling and completions.
- Other Eco Inputs such as operating costs, royalties, abandonment costs, commodity prices, gas plant extraction efficiencies and NGL yields.
- Business Decisions: What KPI to optimize, the operational/economic trade-off between optimal and near-optimal designs.
The Completion Optimization workflow steps:
1. Load Data

Data, such as production, completion, geologic and well costs are loaded into PetroVisor.
2. Forecast Production and Compute KPIs
These are PetroVisor KPIs that become the inputs for ML model training and QA / QC.
3. Choose Training Dataset
Select the dataset for ML model training including geologic, completion, and well spacing parameters.

4. Generate a Prodcution Type Curve
PetroVisor computes a 40-year, time-normalized, average monthly production rate type curve from the entity set used for ML training.

5. Train ML Models
PetroVisor uses Machine Learing models to predict the production for numerous potential completion designs. Simultaneously train multiple models and choose the best.
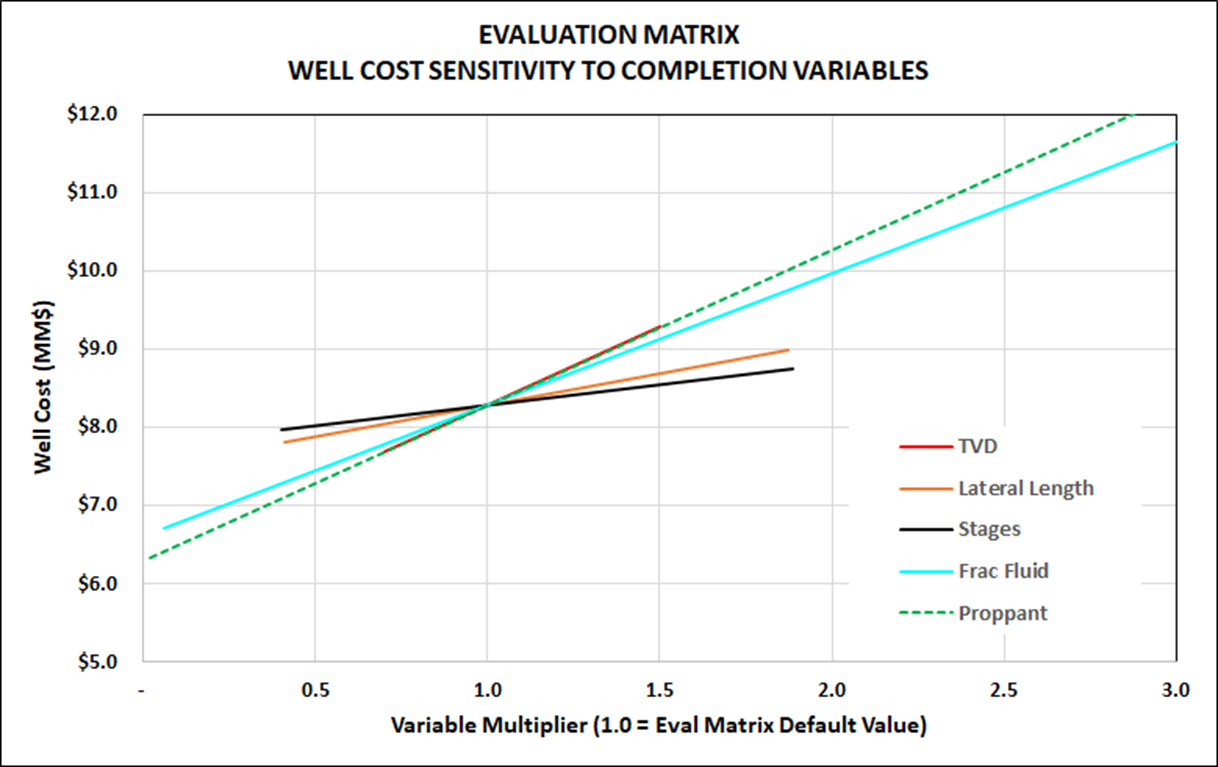
6. Calibrate Economic Models
Calibrate two economic models: Well Cost and Economic Inputs. The Well Cost model generates wells costs based on completion, well spacing and TVD inputs. The Economic Inputs model accounts for operating costs, royalties, gas plant parameters, and commodity price adjustments.
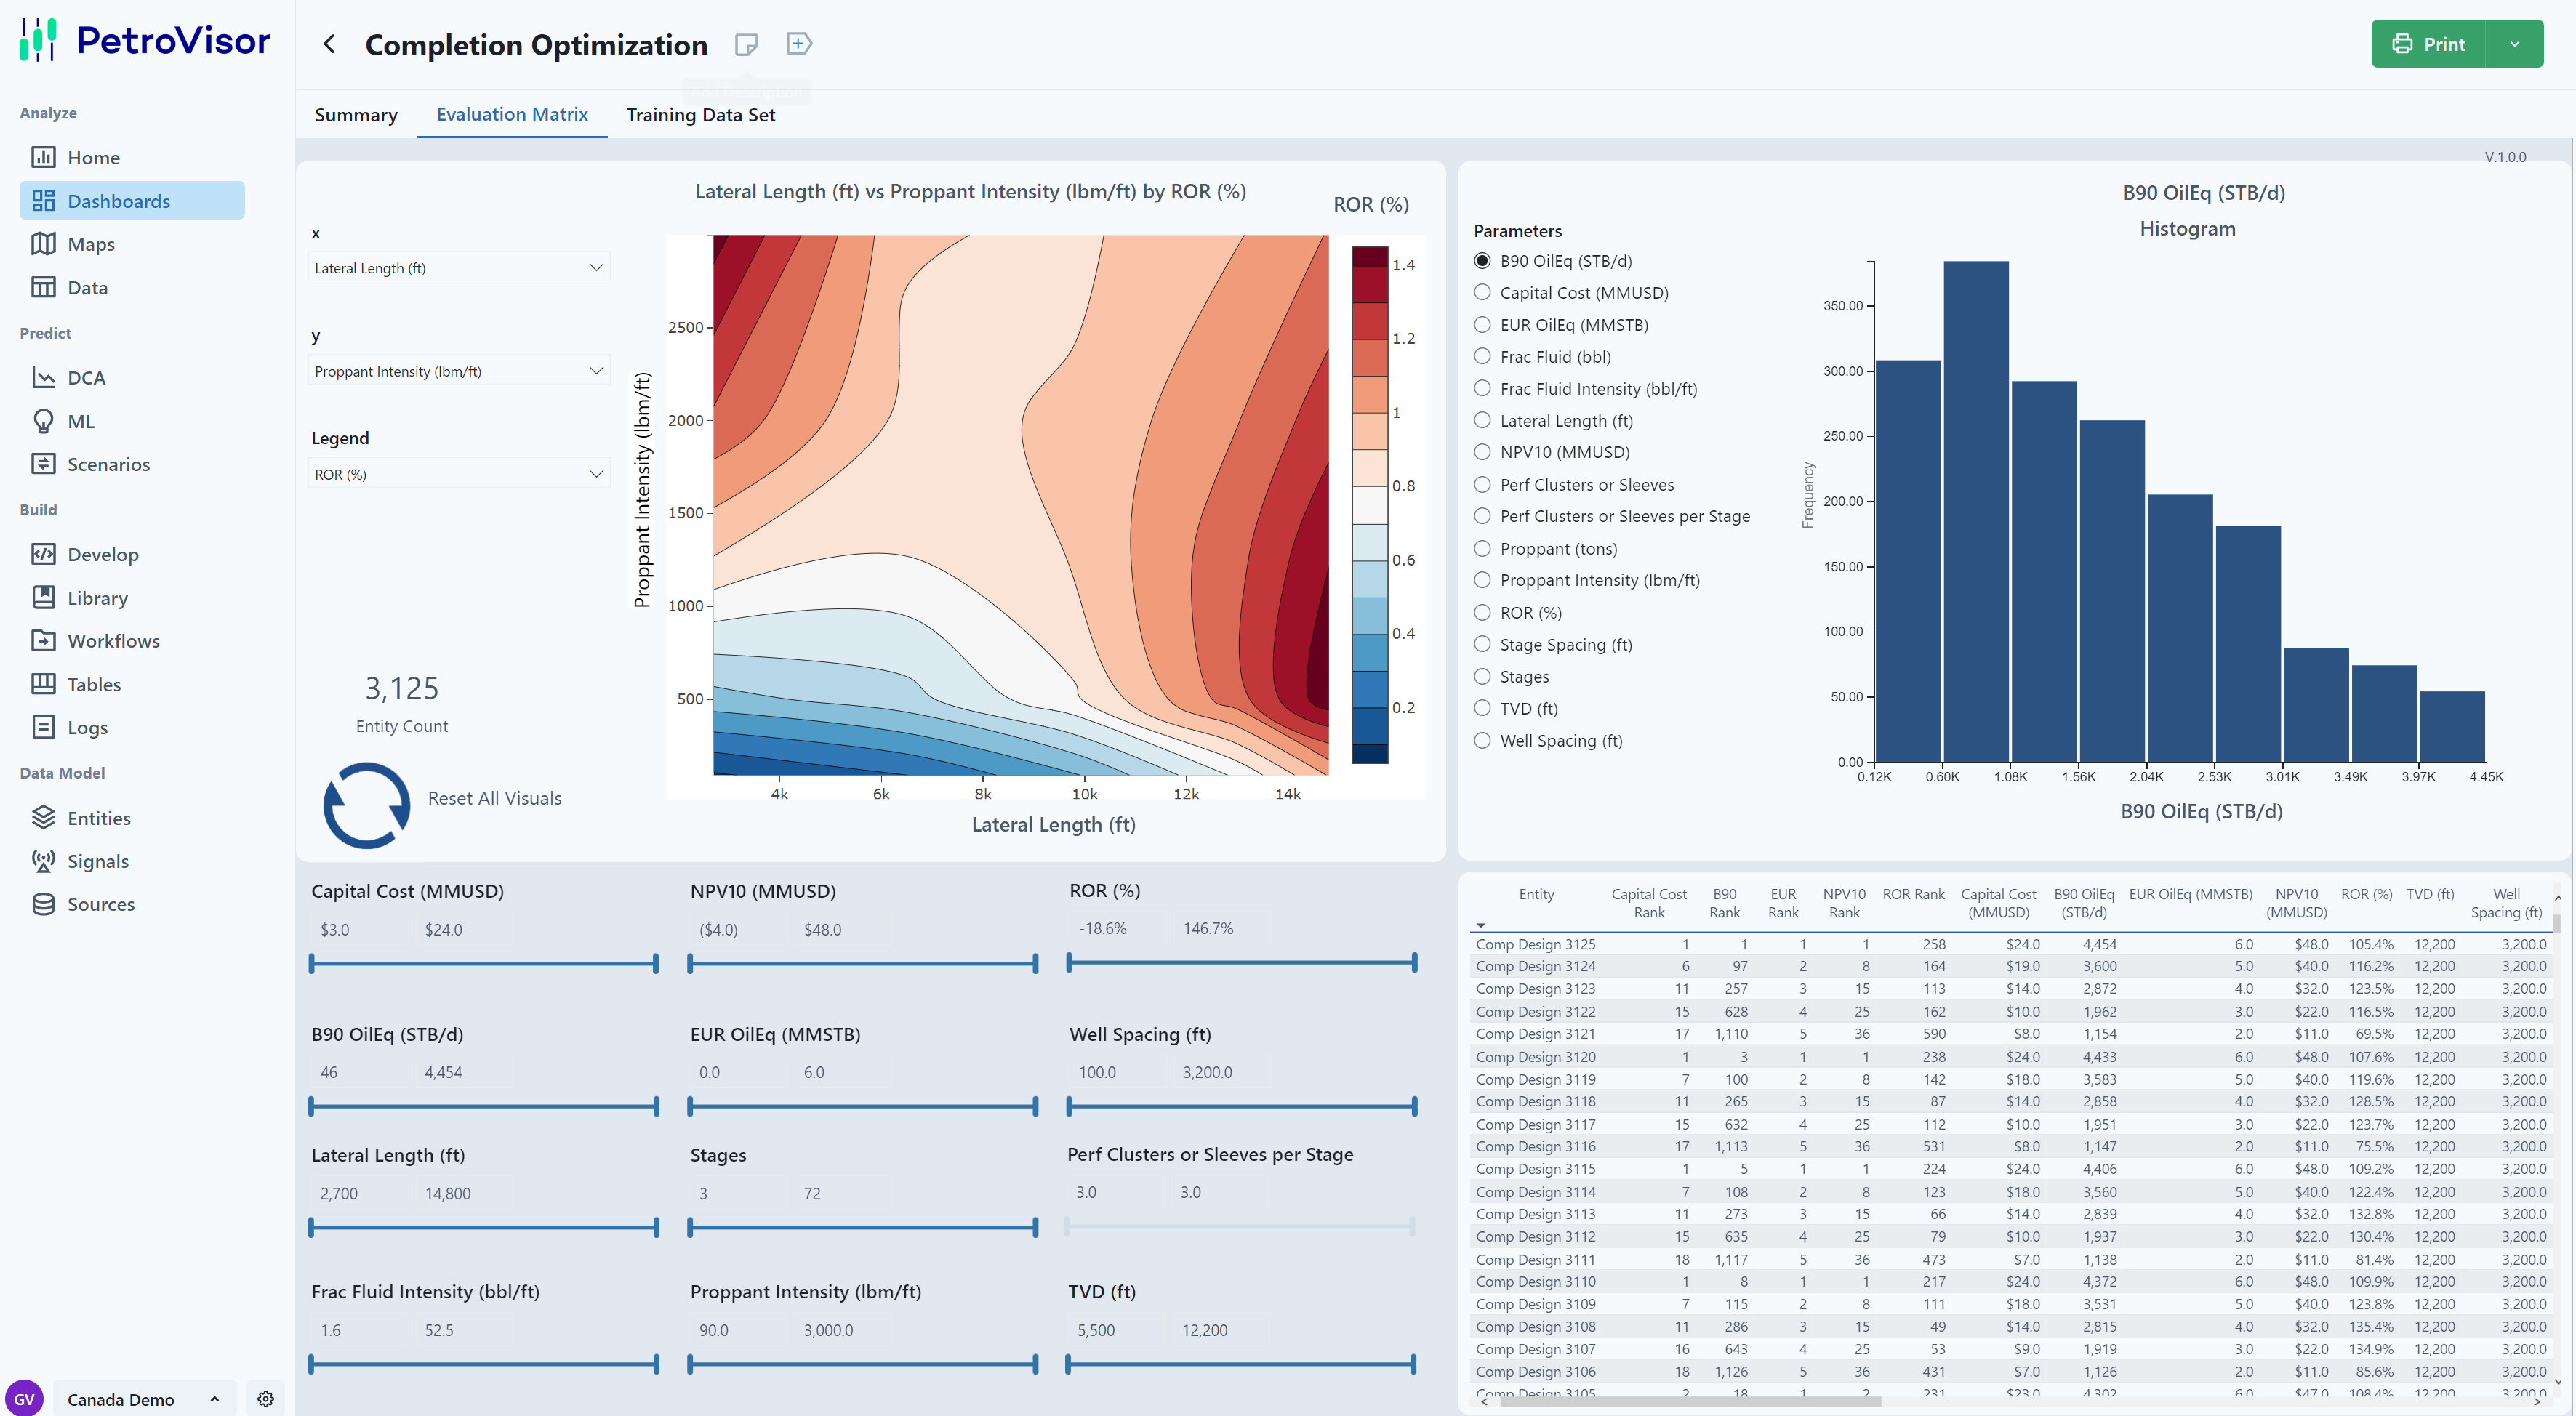
7. Evaluation Matrix
 The Evaluation Matrix is a user-guided compilation of thousands of potential comlpetion designs. The matrix assess a range of completion, geologic, and well spacing values. Each completion design in the Evaluation Matrix generates several economic KPI's such as EUR, ROR, and NPV.
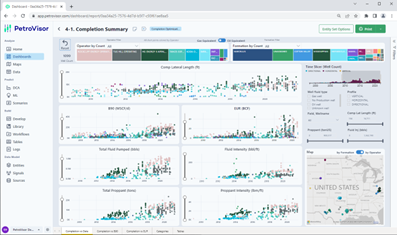
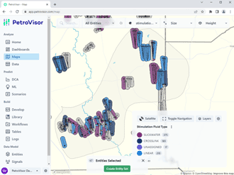
8. Visualization/Decisions
Visualize the matrix of completion design economic KPI's over a range of completion, geologic, and well spacing values with an interactive dashboard. Understand both optimal and near-optimal designs as a function of lateral length, stages, fluid intesity, well spacing, etc.
These steps are often repeated for different training data sets.