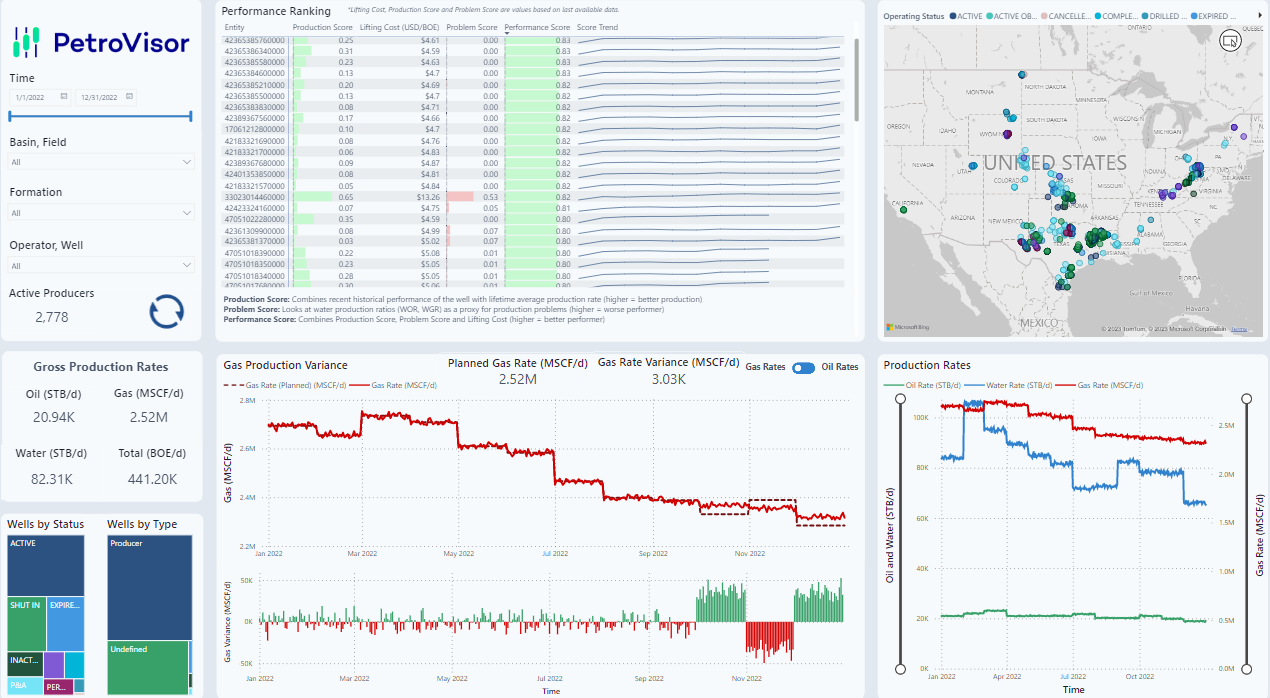
This dashboard serves as a single source well master hub for basic production and financial performance of wells.
The interface includes financial and performance rankings and summary tables of all wells with analysis based on their recent historical production performance. In addition to technical KPIs, financial metrics and variances to target volumes are also included to provide insights into well performance. By providing an overview of all wells in one place, this dashboard has a broad appeal to both company executives and engineers. Wells can be filtered and screened based on:
- Historical and recent production data
- Financial data (cash flow and lifting costs)
- Performance scores
- Production variances to target rates
- Surface operating pressures
Finance
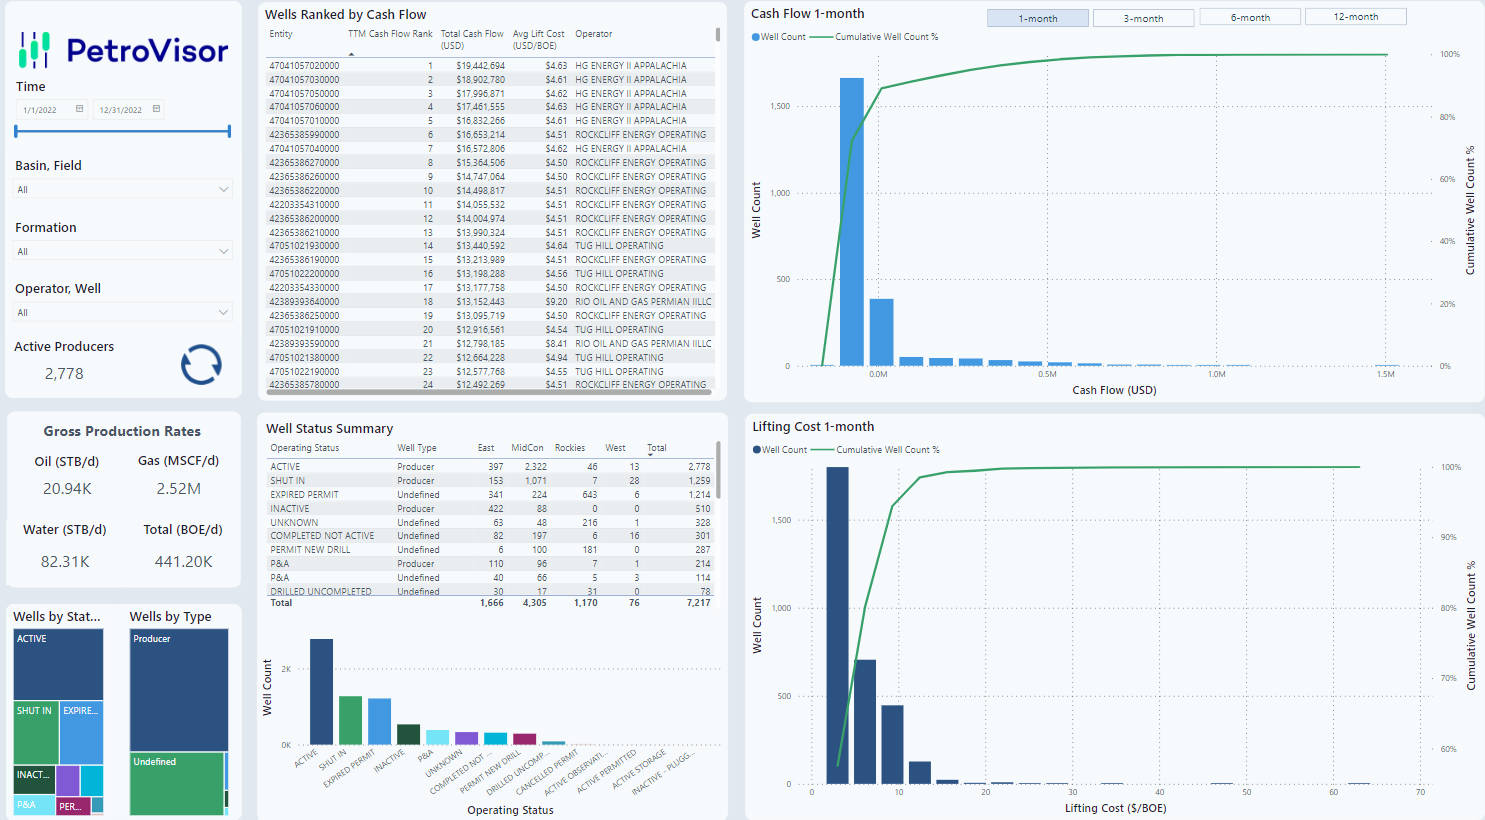
The Finance page is the first of three pages in this report and focuses on financial performance ranking for the trailing twelve-month period. The Finance page includes cash flow and lifting cost rankings of all wells.
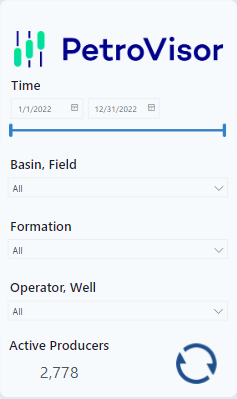
Time, Basin, Field, Formation and Operator
This section filters the data to view specific month, basin, field, formation and operator. Note that this dashboard can be updated daily.
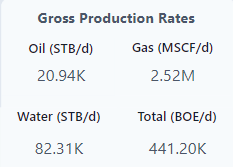
Gross Production Rates
This visual shows the total gross production rates of oil, gas and water for the date period and wells shown in the filter/slicer. For a selected time period, production rates for the selected wells are summed and averaged over the time period. Selecting a slice of any of the visualizations will filter the gross production rates to the selected wells.
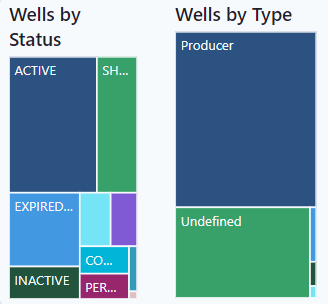
Wells By Status / Wells By Type
This visual displays a tree map chart of the status and types of wells currently selected in the filter/slicer.
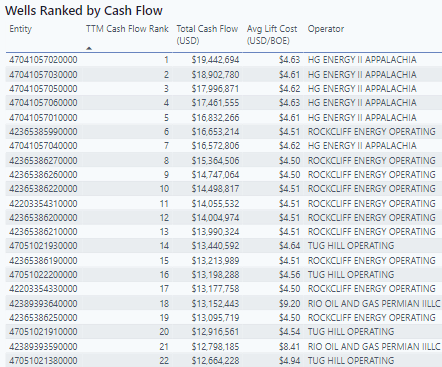
Wells Ranked By Cashflow
The table shows a ranked list of trailing-twelve months cashflows by well, along with an average lifting cost and the operator of the well.
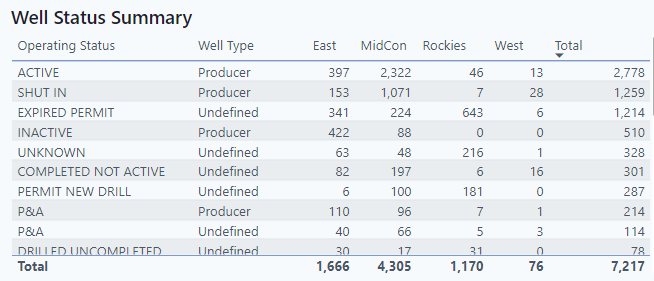
Well Status Summary
This table and bar chart combination show the status of selected wells. In the table, well status are further broken down into different operating units within the company.
Cash Flow Ranking
This visualization ranks the total cash flow from wells in one of four pre-defined time frames from the trailing twelve-month time period: 1-month, 3-months, 6-months and 12-months. The time frame is selected using the button bar at the top of the chart.

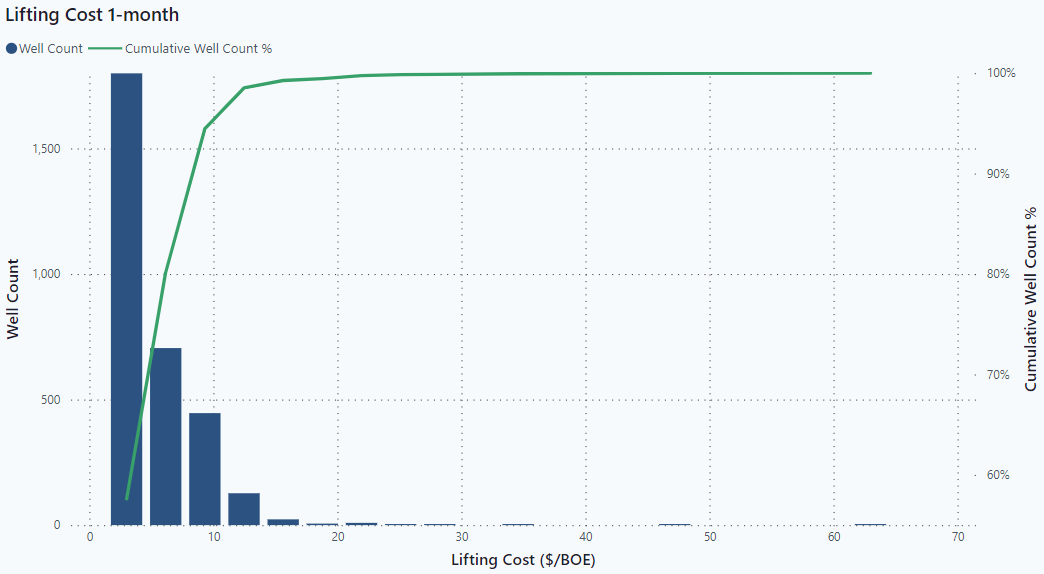
Lifting Cost Ranking
This visualization ranks the average lifting cost of from wells in one of four pre-defined time frames from the trailing twelve-month time period: 1-month, 3-months, 6-months and 12-months. The time frame is selected using the button bar at the top of the chart.
Operations
The Operations page is the second of three pages in this report and focuses on recent (trailing twelve months) well production performance. The Operations page includes performance rankings, production variance and recent production for all wells.
Performance Ranking
The Performance Ranking visual displays key metrics by well related to recent production and lifting costs.
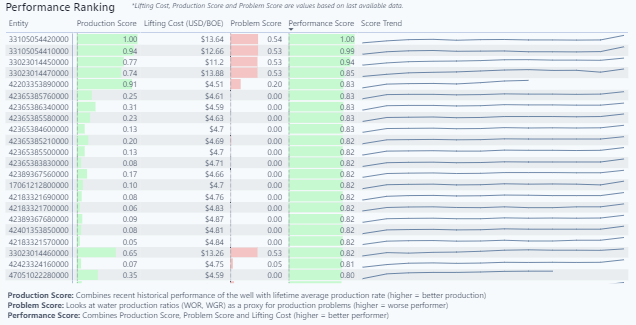
Together with Lifting Cost, there are three production performance scores shown, taken from the most recent analysis of the monthly data:
- Production Score
- Problem Score
- Performance Score
In addition, the score trend from the trailing twelve-month period is also shown.
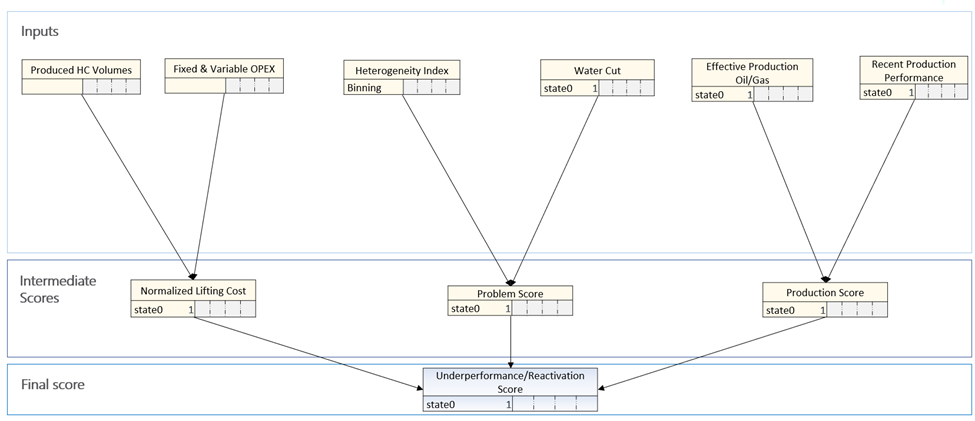
The scoring system is based on the weighted sum of the underlying input features:
Performance Score
A weighted sum of Production, Problem and Lifting Cost scores normalized over all wells.
- Production Score: Combines historic and recent oil and gas production performance of the well. Production Score ranges from 0.0 to 1.0, with higher Production Score indicating a better performing well relative to other wells.
- Problem Score: Combines fluid ratios (water cut for oil wells and water-gas ratio for gas wells) with heterogeneity index classification. Problem Score ranges from 0.0 to 1.0, with higher Problem Score indicating a more problematic well relative to other wells.
- Lifting score: Based on normalized lifting cost. Lifting Score ranges from 0.0 to 1.0, with higher Lifting Score indicating higher lifting cost relative to other wells.
- The final production score is the weighted sum of the underlying input scores as follows:
Performance Score = W1*Production Score + W2*(1.0 - Problem Score) + W3*(1.0 - Lifting Score)
Per the score descriptions given above, this formula results in a higher Performance Score when the Production Score is high, and the Problem Score and/or Lifting Score are low. Conversely, the Performance Score will be lower when Problem Score and/or Lifting Score are high.
The weights can be customized for customer preferences, as some customers might prefer to give more weight to the lifting score while other customers may focus more on the technical scores. The default weight values used for the calculations are W1 = 4, W2 = 0.2 and W3 = 0.4.
Production Score
The Production Score gauges a well’s production performance. It consists of:
- Recent production performance
- Normalized cumulative oil or gas production (an average lifetime production rate)
- Initial oil or gas rate
Problem Score
The Problem Score estimates the occurrence of various types of problems detected in the entity. It is comprised of:
- Water problems (watercut for oil wells and water-gas ratio for gas wells)
- Heterogeneity Index
Water problems are evaluated by taking the moving average of recent water cut performance (oil wells) or water-gas ratio performance (gas wells) and normalizing the values. Thus, the Problem Score would be higher on those wells with high water cut or water-gas ratio for the chosen time period (currently last 12 months; can be changed by the customer).
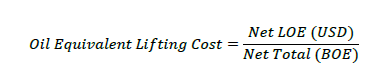
Lifting Cost
Lifting Cost is defined as:
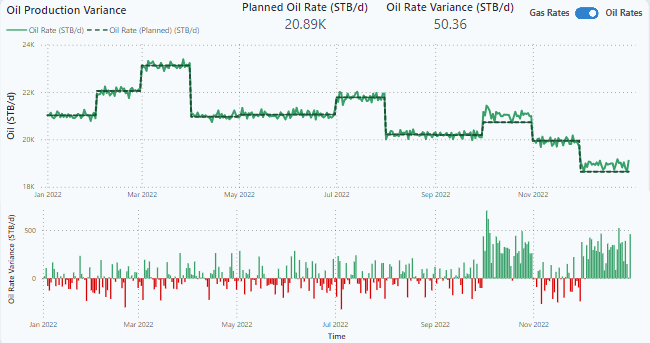
Production Variance
This chart displays the variance from a planned production rate (oil or gas) for the wells and time period selected in the filter/slicer.
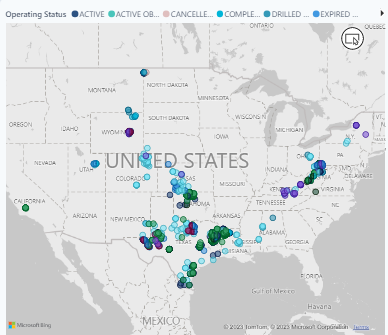
Operating Status Map
This map shows all the wells currently selected by the filter/slicer, color coded to the operating status of the wells.
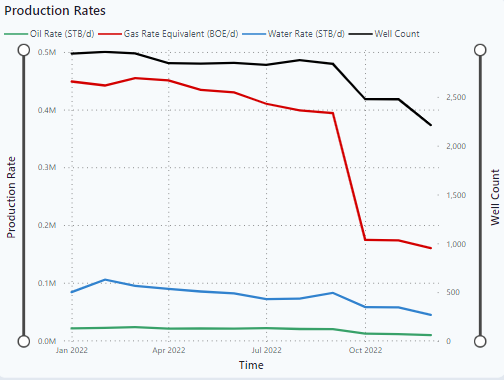
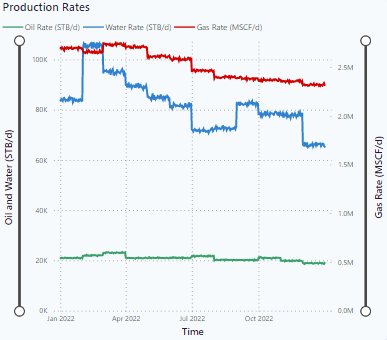
Production Rates
This chart shows the historical oil, gas and water production rates for the wells and time period currently selected by the filter/slicer. The rates displayed are daily rates for a maximum period of the trailing twelve-months.
Tables
The Tables page is the third of three pages in this report and focuses on tabular presentation of basic well information. The Tables page can include data from as many wells as are included in the Filter/Slicer, down to an individual well.
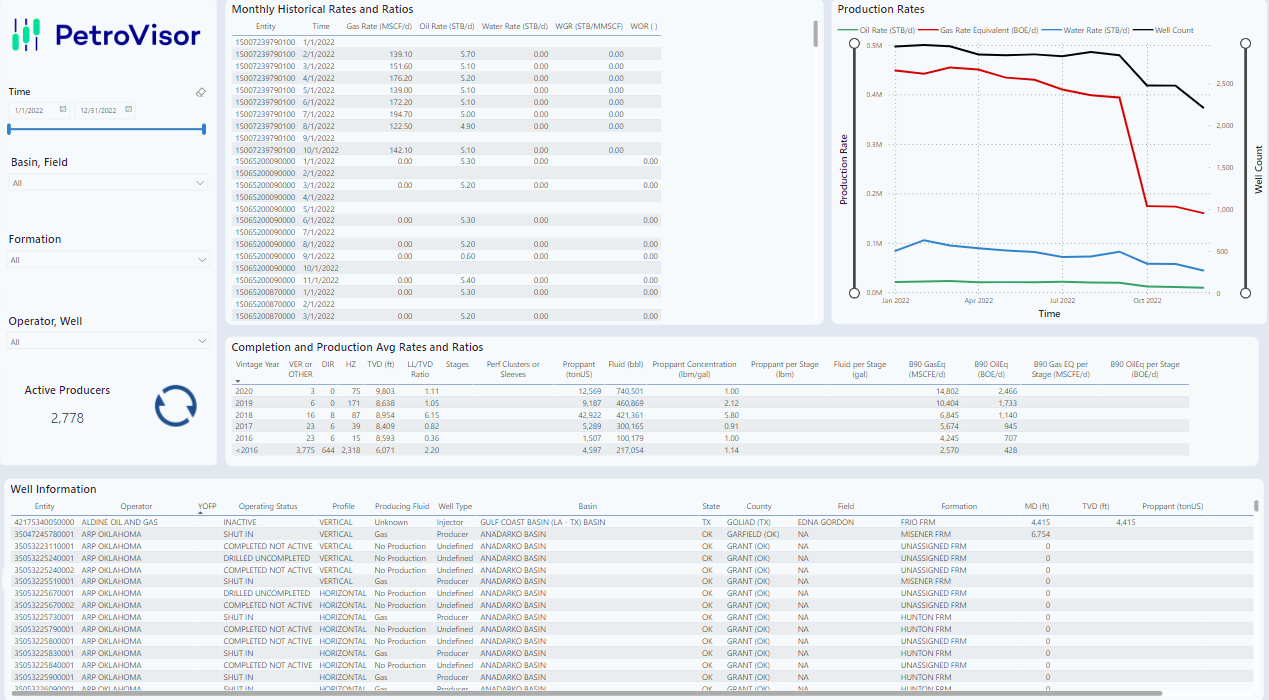
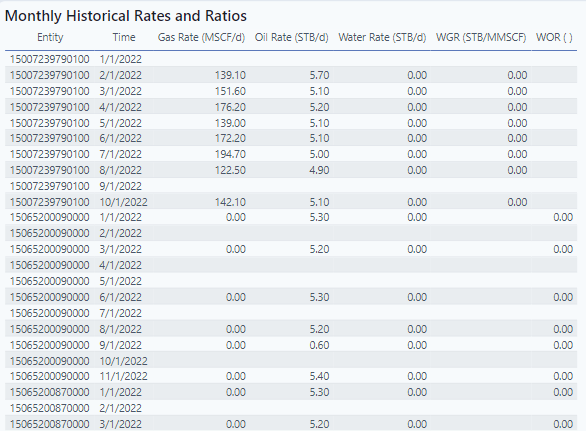
Monthly Historical Rates and Ratios Table
The Monthly Historical Rates and Ratios table presents monthly oil, gas and water production data and fluid ratios (WOR, WGR) for the wells selected in the Filter/Slicer.
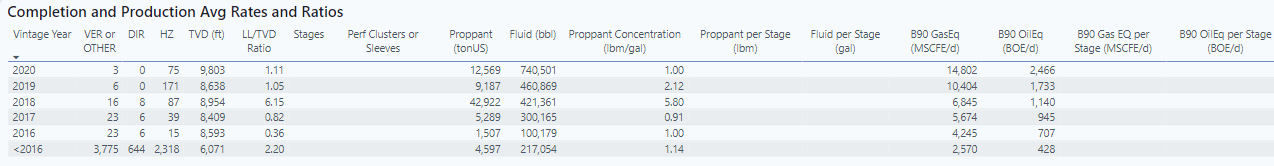
Completion and Production Average Rates and Ratios Table
The Completion and Production Average Rates and Ratios table summarizes completion data and production Key Production Indicators (KPIs) by vintage year. A vintage year is defined as the year of first production for each well.
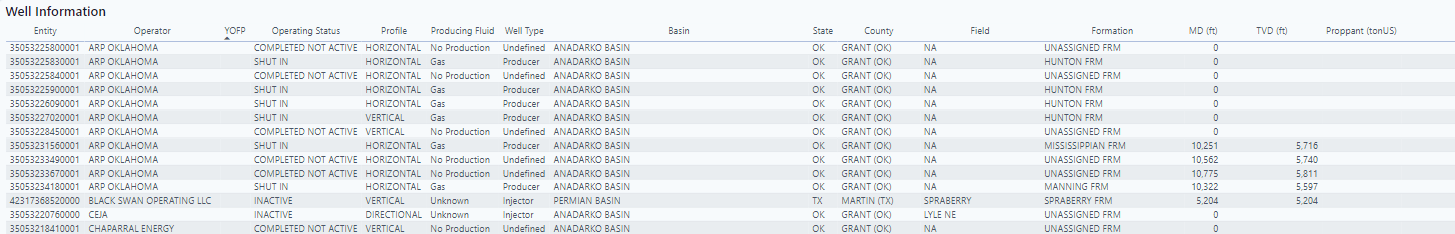
Well Information Table
The Well Information table presents basic data for each well, including cultural information (State, County, Basin, Field, etc.) and key data like depths, operating status, and wellbore profile.
Production Rates Chart
The Production Rates chart presents the total oil, gas, and water production rates over the previous twelve months for the wells and time period selected in the Filter/Slicer.