-
Getting Started
-
Customer Training
-
Customer Success
-
Updates
-
Production Optimization
-
Completion Optimization
-
Environmental, Social & Governance
-
Development, Acquisition & Divestitures
-
Enhanced Oil Recovery
-
Admin
-
P#
- Getting Started with P#
- Data Cleansing
- String Functions
- Scenario Functions
- Regression Functions
- Placeholder Functions
- Neighborhood Functions
- Mathematical Functions
- Logic Functions
- Entities Function
- Moving Window Functions
- Time and Date Functions
- Statistical Functions
- Economic Functions
- Data Handling
- Additional Functions
- Directional Functions
- Machine Learning Functions
- DCA Functions
-
Packages
Well Status
The PetroVisor Well Status Dashboard is for Engineers to look at wells as active and inactive.
Overview
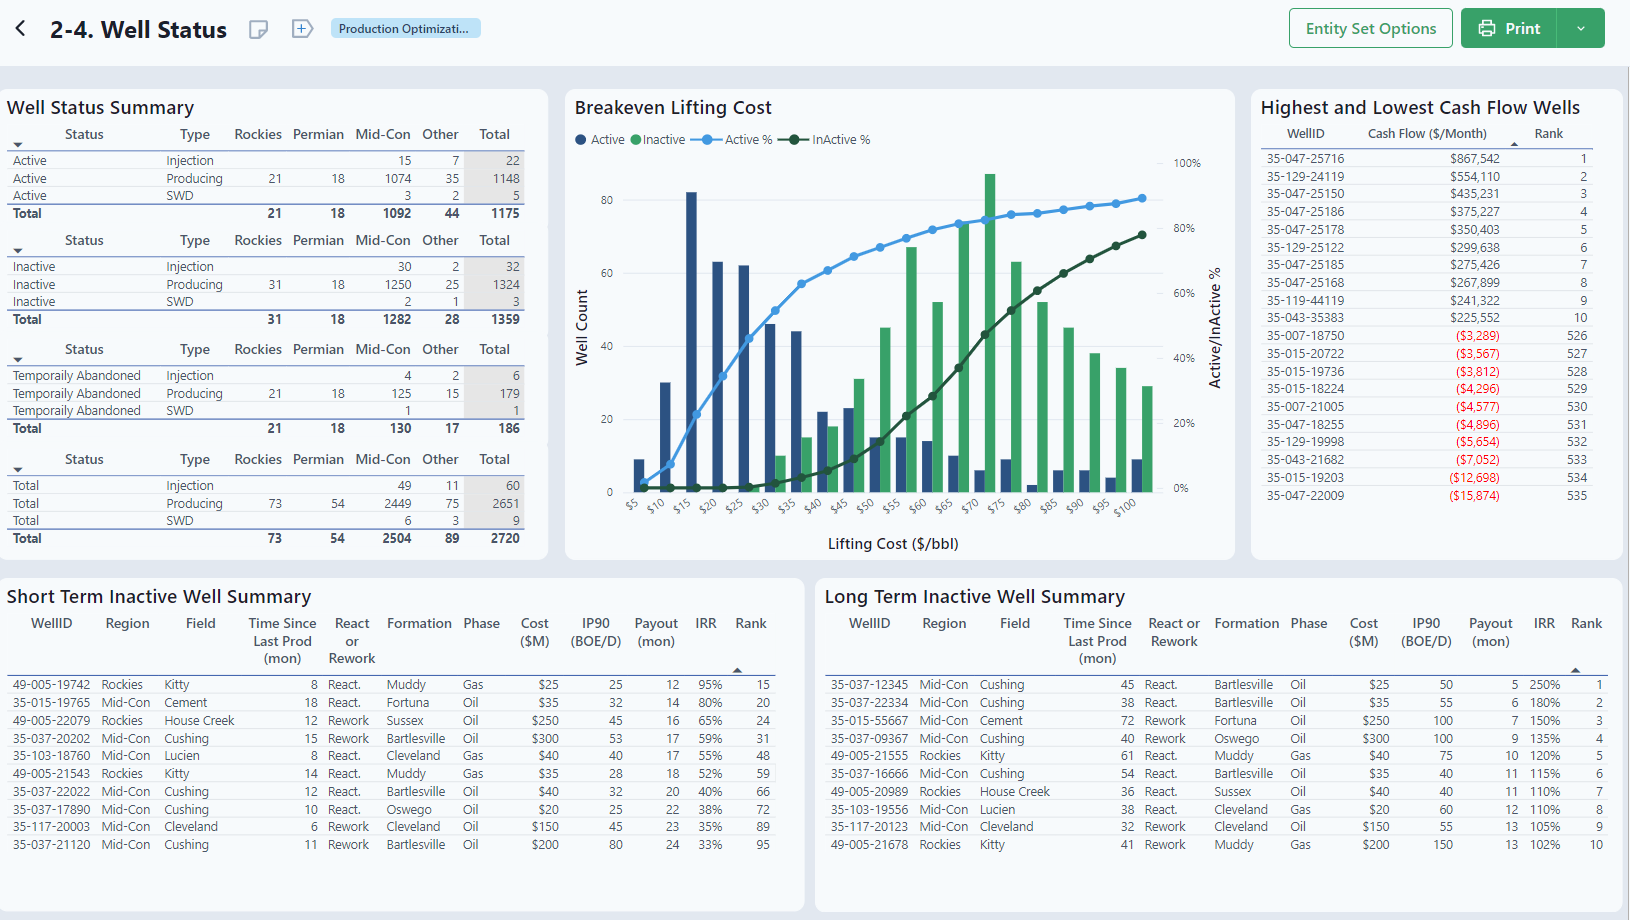
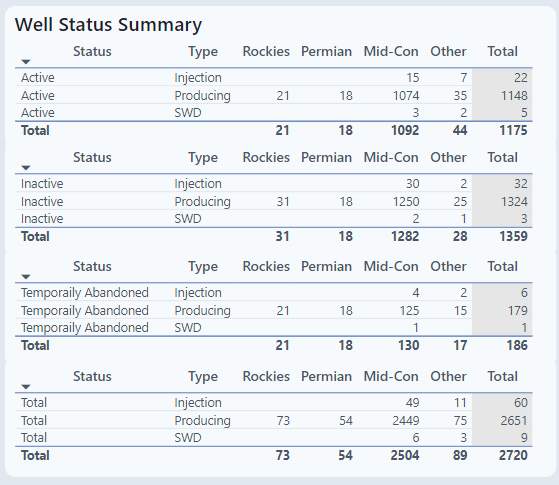
Well Status Summary
This table lists wells by active, inactive, and temporarily abandoned by region.
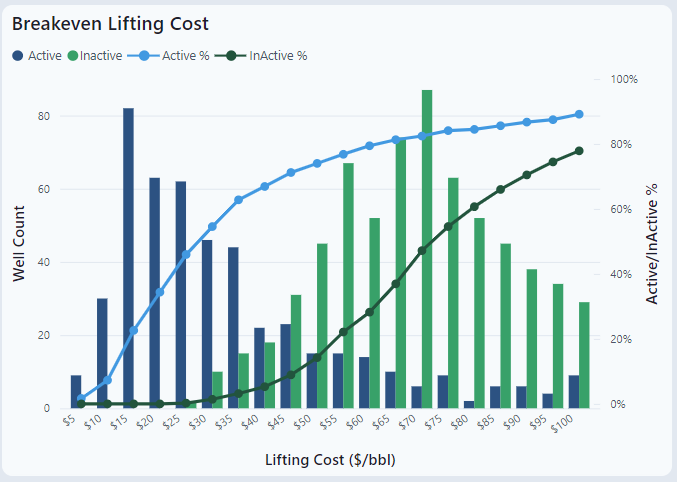
Breakeven Lifting Cost
The Breakeven histogram details the lifting cost (and price of oil) of wells by active vs. inactive. As the lifting cost decreases, the number of wells should increase.
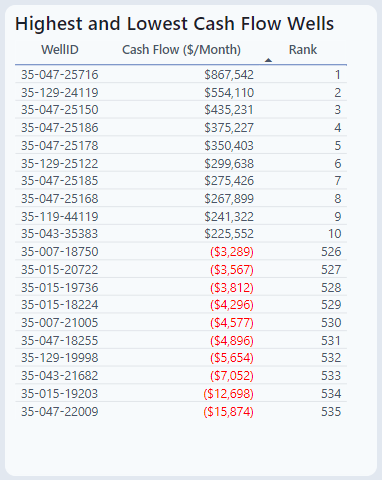
Highest and Lowest Cash Flow Wells
This table lists the top 10 and bottom 10 wells according to cash flow. Notice that the lowest cash flow values are negative in the example.
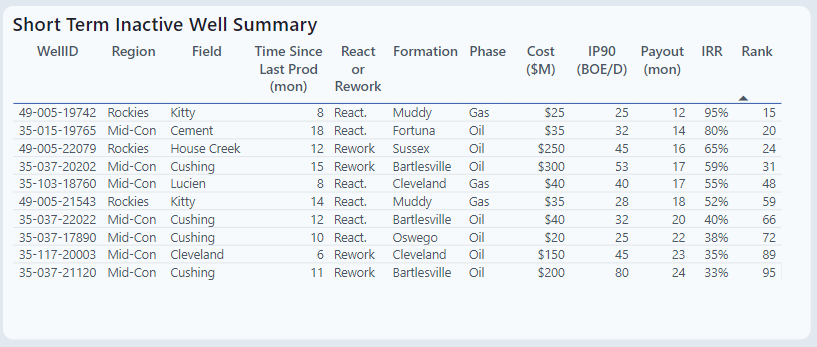
Short Term Inactive Well Summary
Short Term (time determined by client) Inactive Well Summary ranks wells by IRR. This ranking enables the engineer to quickly determine which wells to reactivate.
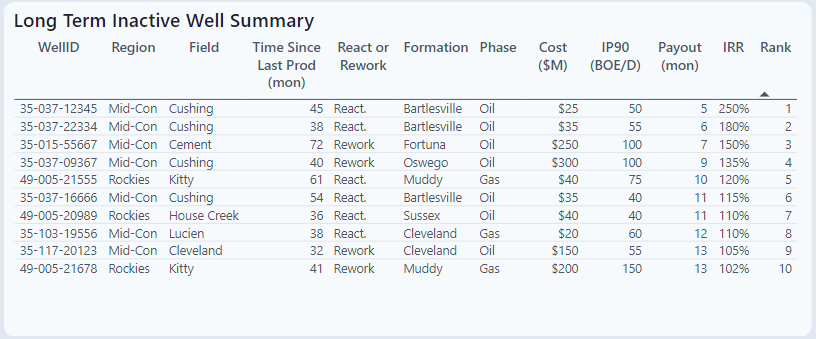
Long Term Inactive Well Summary
Long Term (time determined by client) Inactive Well Summary ranks wells by IRR. This ranking enables the engineer to determine if a well should be reactivated, abandoned, or sold.