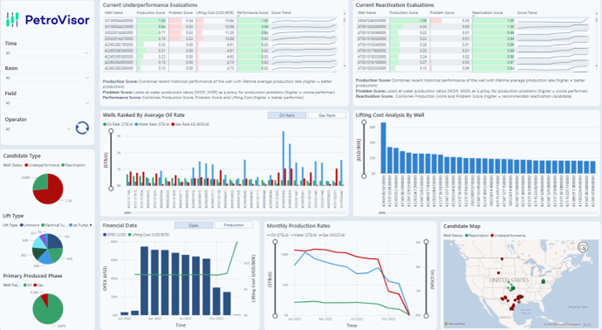
This dashboard provides an automated opportunity register for wells to be reactivated and list of underperforming wells for an engineer to optimize.
The interface includes ranking and summary tables of each well with analysis based on their historical production performance. In addition to technical KPIs, financial metrics are also included to supplement opportunity ranking and decision making. This dashboard for the engineering team gives an overview of the wells which can be screened based on:
- Historical and recent Production data
- Financial data (mainly lifting costs)
- Different calculated scores
- Surface operating pressure signals
- Analysis plots and comparison metrics
Underperformance & Reactivation
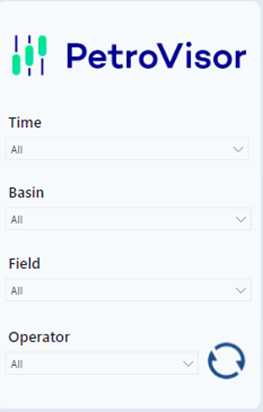
Date, Basin, Field and Operator
This section filters the data to view specific month, basin, field, and operator. Note that this dashboard is updated monthly.
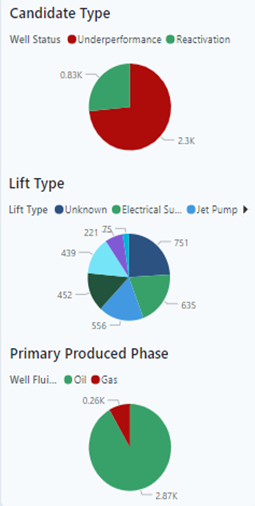
Candidate Type
This section provides pie charts to look at inventory of underperformance and reactivation candidates based on lift type and primary producing phase. These visualizations provide a quick overview of the field or area performance since the user can quickly see if there are changes in the candidate breakdown (e.g., more or less reactivation candidates) compared to the previous months. Selecting a slice of any of the visualizations will filter the data to those wells.
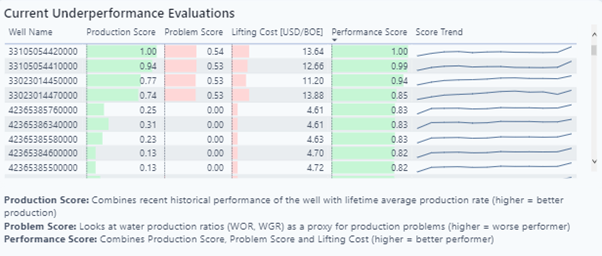
Current Underperformance Evaluations
The table shows a ranked list of underperformance candidates based on three metrics combined into the performance score. The table also shows the trend of the performance score over time. Engineers can quickly rank the underperforming wells (those having the lowest performance score) to prioritize further evaluation for remediation or intervention.
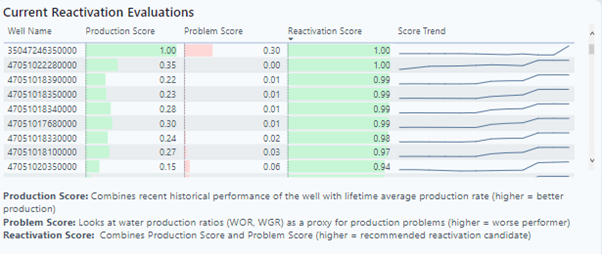
Current Reactivation Evaluations
The table shows a ranked list of reactivation candidates based on three metrics combined into a reactivation score. The table also shows the trend of the reactivation score over time. Engineers can quickly rank the reactivation candidates (those having the highest reactivation score) to prioritize further evaluation for intervention and reactivation.
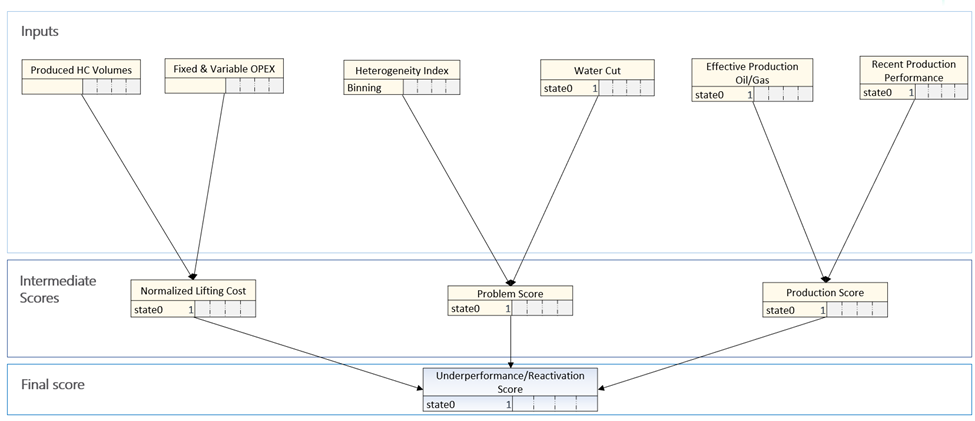
Candidate Scores
The scores are the weighted sum of the underlying input features:
Performance Score: Combined sum of production, problem and lifting scores normalized over all underperformance candidates.
- Production Score: Combines historic and recent oil and gas production performance of the well. Production Score ranges from 0.0 to 1.0, with higher Production Score indicating a better performing well relative to other wells in the entity set.
- Problem Score: Combines fluid ratios (water cut for oil wells and water-gas ratio for gas wells) with heterogeneity index classification. Problem Score ranges from 0.0 to 1.0, with higher Problem Score indicating a more problematic well relative to other wells in the entity set.
- Lifting score: Based on normalized lifting cost. Lifting Score ranges from 0.0 to 1.0, with higher Lifting Score indicating higher lifting cost relative to other wells in the entity set.
The final production score is the weighted sum of the underlying input scores as follows:
Performance Score = W1*Production Score + W2*(1.0 - Problem Score) + W3*(1.0 - Lifting Score)
Per the score descriptions given above, this formula results in a higher Performance Score when the Production Score is high, and the Problem Score and/or Lifting Score are low. Conversely, the Performance Score will be lower when Problem Score and/or Lifting Score are high.
The weights can be customized for customer preferences, as some customers might prefer to give more weight to the lifting score while other customers may focus more on the technical scores. The default weight values used for the calculations are W1 = 0.4, W2 = 0.2 and W3 = 0.4.
Reactivation Score: Combined sum of production and problem scores, normalized over all reactivation candidates.
- Production Score: Combines historic and recent oil and gas production performance of the well. Production Score ranges from 0.0 to 1.0, with higher Production Score indicating a better performing well relative to other wells in the entity set.
- Problem Score: Combines fluid ratios (water cut for oil wells and water-gas ratio for gas wells) with heterogeneity index classification. Problem Score ranges from 0.0 to 1.0, with higher Problem Score indicating a more problematic well relative to other wells in the entity set.
The final reactivation score is the weighted sum of the underlying input scores as follows:
Reactivation Score = W1*Production Score + W2*(1.0 - Problem Score)
Per the score descriptions given above, this formula results in a higher Reactivation Score when the Production Score is high, and the Problem Score is low. The implication is that the well is a good producer with a low problem score, the ideal candidate for reactivation. Conversely, the Reactivation Score will be lower when the Production Score is low and the Problem Score is high.
The weights can be customized for customer preferences, as some customers might prefer to give more weight to one of the two inputs to the Reactivation Score. The default weight values used for the calculations are W1=0.65, and W2=0.35.
Production Score
The Production Score gauges an entity’s production performance. It consists of:
- Recent production performance
- Normalized cumulative oil (an average lifetime production rate)
- Initial oil rate
Problem Score
The Problem Score estimates the occurrence of various types of problems detected in the entity. It is comprised of:
- Water problems (watercut for oil wells and water-gas ratio for gas wells)
- Heterogeneity Index
Water problems are evaluated by taking the moving average of recent water cut performance (oil wells) or water-gas ratio performance (gas wells) and normalizing the values. Thus, the Problem Score would be higher on those wells with high water cut or water-gas ratio for the chosen time period (currently last 12 months; can be changed by the customer).
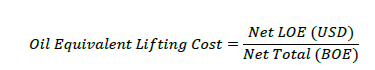
Lifting Cost
Lifting Cost is defined as:
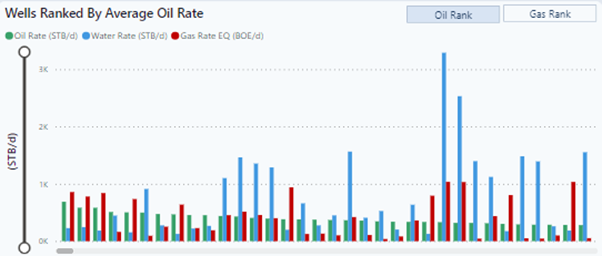
Wells Ranked By Average Oil Rate
This chart displays all the wells in the Reactivation and Underperformance candidate list ranked by highest oil or gas rate, expressed in oil equivalent units. Hovering over a bar will show the well's name and oil or gas rate, in BOE/d.
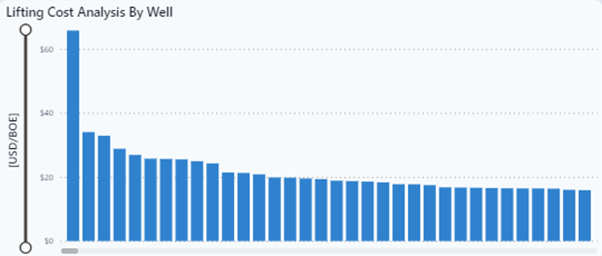
Lifting Cost Analysis By Well
This chart ranks all the wells in the Reactivation and Underperformance candidate list by lifting cost. The lifting cost formula was presented earlier. Hovering over a bar will display the well's name and lifting cost.
The plot will help the engineer identify the wells with the highest lifting costs compared to the rest of wells and investigate the reasons for the high lifting costs and possible remediation actions to reduce those lifting costs.
Financial Data
This chart has a selector for either Operating Expenses (OPEX) or Production.
- OPEX: displays Total Operating Expenses and Average Lifting Cost over time
- Production: displays Total Production (BOE) and Average Lifting Cost over time
The OPEX chart aggregates total operating expenses by month for all the wells in the Reactivation and Underperformance candidate list, and shows an average lifting cost for all the wells in the candidate list. The Production chart aggregates total oil and gas production (expressed in oil equivalent BOEs) and combines that with an average lifting cost for all the wells in the candidate list.
This chart can be used to diagnose if changes in lifting cost are due to excessive operating expenses or a significant drop in production.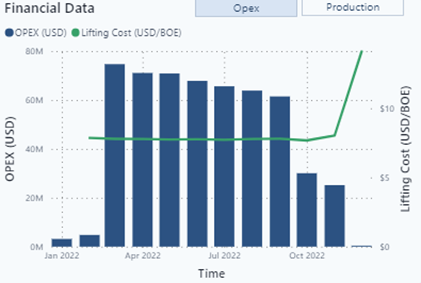
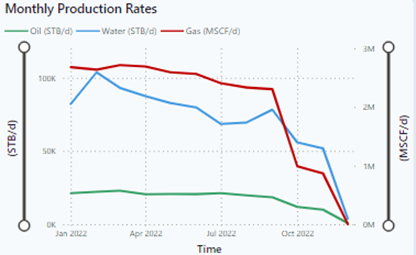
Monthly Average Production Rates
Production of Oil, Water and Gas over time, expressed as average monthly production rates.
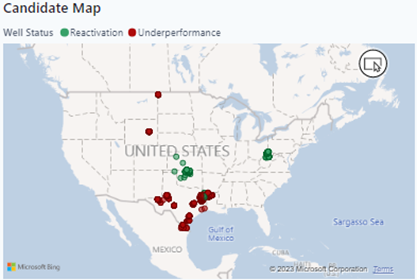
Candidate Map
This bubble map shows the candidate classification (either a reactivation or underperformance candidate). Hovering over a well will display wells classification and coordinate location. The recommended use of this map is to use the filter on the left to either view the locations of reactivation or underperformance candidates.
Diagnostics
In the Diagnostics tab, the Filters and Current Performance Ranking and the Reactivation Candidates remain the same as the Summary tab. The Diagnostics Tab dives deeper into Heterogeneity Index, and surface operating pressures (casing, tubing and line pressure), as well as actual and forecasted production rates.
The Heterogeneity Index (HI) plot is an analysis tool that compares the performance of a well with the average performance of a group of offset wells (can be grouped by formation, area, field, etc.). The HI plot outputs on to four quadrants, with each quadrant defining a category of specific performance characteristics and defining a possible need for treatment or intervention management.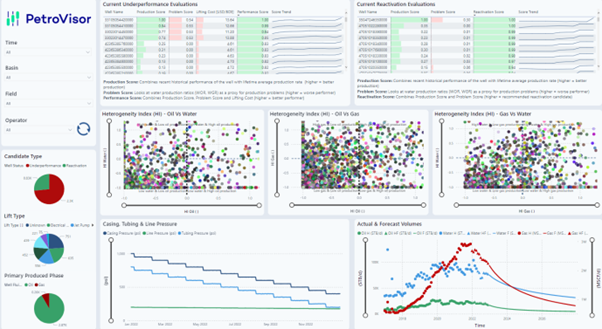
Heterogeneity Index Analysis
The Heterogeneity Index (HI) normalizes the effects of the well's production and reservoir pressure. The HI allows for a comparative analysis of completion efficiency and reservoir quality for many producing wells.
Heterogenity Index
The Heterogeneity Index is an analysis tool which compares the well performance with the average performance of a group of its offsets (can be formation, area, field, etc). The plot is subdivided into four quadrants, with each quadrant representing a category of specific performance-related issues. Based on the quadrant, decisions can be made with respect to interventions and remediations (such as stimulation, water shut off, etc.).
The Heterogenity Index formula used to calculate HI for each phase is
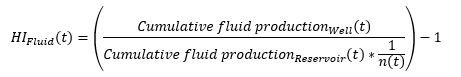
where:
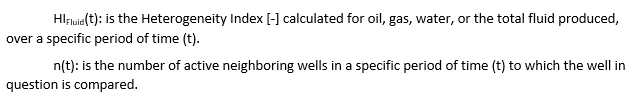
The Heterogeneity Index normalizes the effects of the well's production lifetime and reservoir pressure. This allows for a comparative assessment of completion efficiency and reservoir quality of many producing wells.
A typical HI plot is shown below. The HI of the oil phase (HI Oil on the x-axis) is plotted against the HI of the water phase (HI Water on the y-axis) to help identify possible workover candidates for water control measures and acid stimulation and fracturing as detailed below.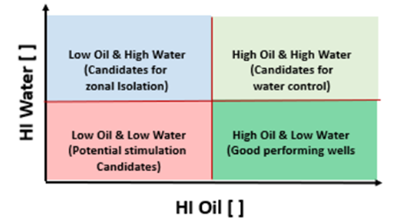
The HI Plot can be divided into four quadrants. The best performing oil wells would lie in the lower right quadrant of the HI plot. indicating higher-than-average oil production and lower-than-average water production. On the other hand, the worst performing wells lie in the upper left quadrant with lower-than-average oil production and higher-than-average water production. A well with such conditions needs further investigation and could be recommended for a water shut-off action.
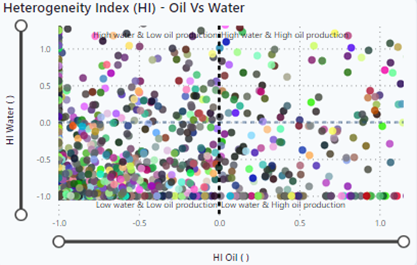
HI Oil vs HI Water
Uses the HI quadrant definitions shown above for evaluating production performance of oil wells and identifying potential workover candidates and underperforming wells.
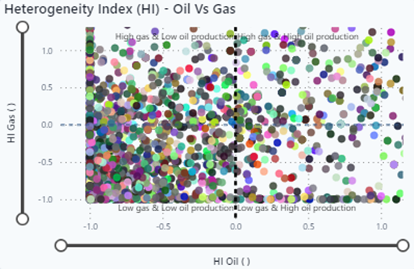
HI Oil vs HI Gas
Uses the HI quadrant definitions shown above for evaluating production performance of oil wells and identifying potential workover candidates and underperforming wells.
HI Gas vs HI Water
Uses the HI quadrant definitions shown above for evaluating production performance of gas wells and identifying potential workover candidates and underperforming wells.

Casing, Tubing, & Line Pressure
This graph shows the average surface operating pressures of a well over time so that the engineer can combine this information with entity scores and heterogeneity indexes to refine their analysis of the well’s performance.

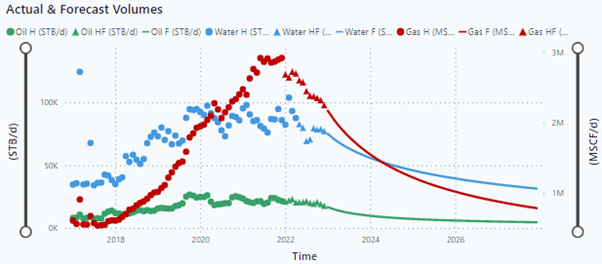
Actual & Forecast Volumes
This graph displays recent historical and forecast production rates over time. The plot shows the prior five years of history plus the next five years of forecasted rates.