The Production Forecast (DCA) Package
- Performs automated regression fits and forecasts of production data using Arps exponential, harmonic and hyperbolic models
- Combines a multi-pass approach with automated outlier detection and removal and a decision tree to ensure high-quality fits and forecasts
- Handles monthly and daily data
- Can independently fit oil, gas, water and condensate production data and automatically generate secondary phase forecasts for all remaining phases
Regression (Fitting) Summary
- Automatically fit up to 3 parameters (Q_i, D_i, b_exp)
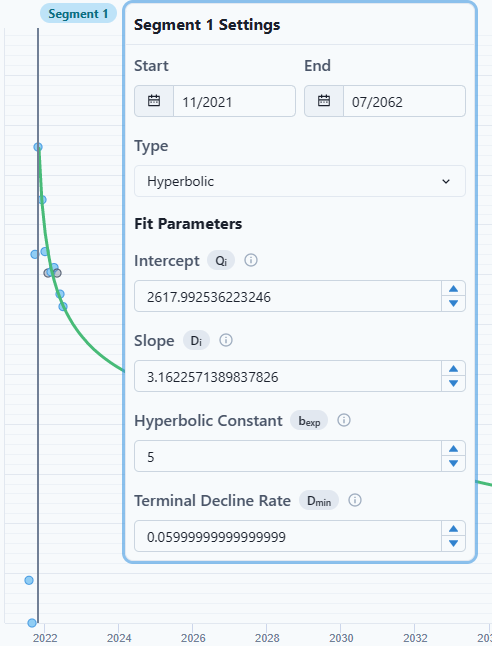
- Use a regression time window that can be a subset of the full production history, and within that window, start regression at the peak rate, if desired
- Fit to the best of Arps exponential, harmonic and hyperbolic models based on R2
- Use bounded (min & max) parameters for regression
- Q_i (all models): ranges from zero to multiple of maximum rate in regression dataset (currently 5.0x)
- D_i: user-defined min to max values; all decline rates are nominal, expressed in #/year
- b_exp: user-defined min to max values
Regression - Automated Outlier Detection & Removal
- Automatic outlier detection and removal using error analysis and an error ratio hurdle based on RMS
- Uses an initial fit as the basis for the error calculation
- Includes linear error/RMS ratio, log(error)/log(RMS) ratio or both (defined by Workspace Value AutoDCAOutlierMethod)
- RMS ratio hurdle is typically 1.5 (Workspace Value AutoDCAOutlierThreshold)

- Two-pass fitting with outlier detection between fit passes
- Initial fit pass has no outliers; all data in the regression window are part of the fit
- Error analysis identifies and removes outliers by comparing initial fit to actual data using the outlier detection algorithm described above
- Second fit pass is on the data with the outliers excluded
Decision Tree - Data Pre-Processing
- Goal: every entity with at least 1 data point of production should get a forecast
- Scan data to detect these conditions as part of the staging process before the regression analysis begins
- Entities with ≥ 6 points of regression data will get a 3-parameter (Q_i, D_i, b_exp) fit
- When < 6 points and > 2 points of regression data, do a 2-parameter (Q_i, D_i) fit using default b_exp-value (can be placeholder or Workspace Value)
- When only 2 points of data, fit with 1-parameter (Q_i) using a default D_i and b_exp-value (placeholder or Workspace Value)
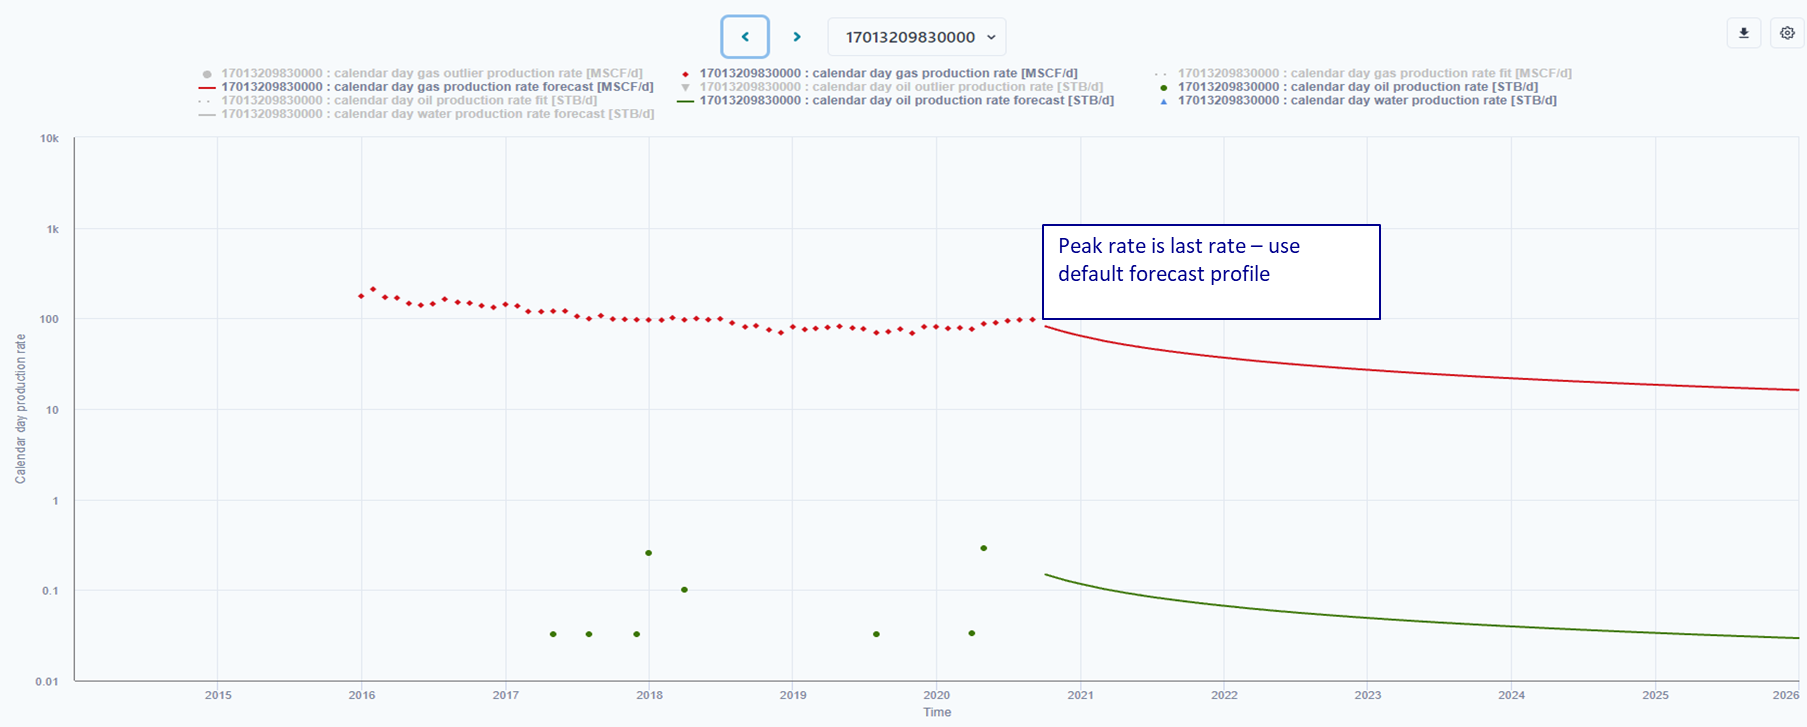
- When the peak rate in the regression window is the last point (i.e., flat or inclining production) or there is only 1 data point, fit with 1-parameter (Q_i) using a default D_i and b_exp-value (placeholder or Workspace Value)
Decision Tree - Checking for Curtailment
After completing a full initial analysis (i.e., two-pass workflow) to get an EUR, check for signs of curtailment:
- If all these conditions are met, it is considered a curtailed production profile and will be re-analyzed
- Condition 1: Cumulative production/EUR ≤ 0.2
- Condition 2: EUR/B90 ≥ 4.0
- Condition 3: D_i / D_min ≤ 3.0
- When curtailment is detected, refit and forecast using 1-parameter (Q_i) fit starting with the flow rate at the end of history, with a default D_i and b_exp-value
Decision Tree - Other Special Situations
In these circumstances, regression analysis is skipped
- When all the input data become outliers
- When the primary phase is undefined (this is rare)
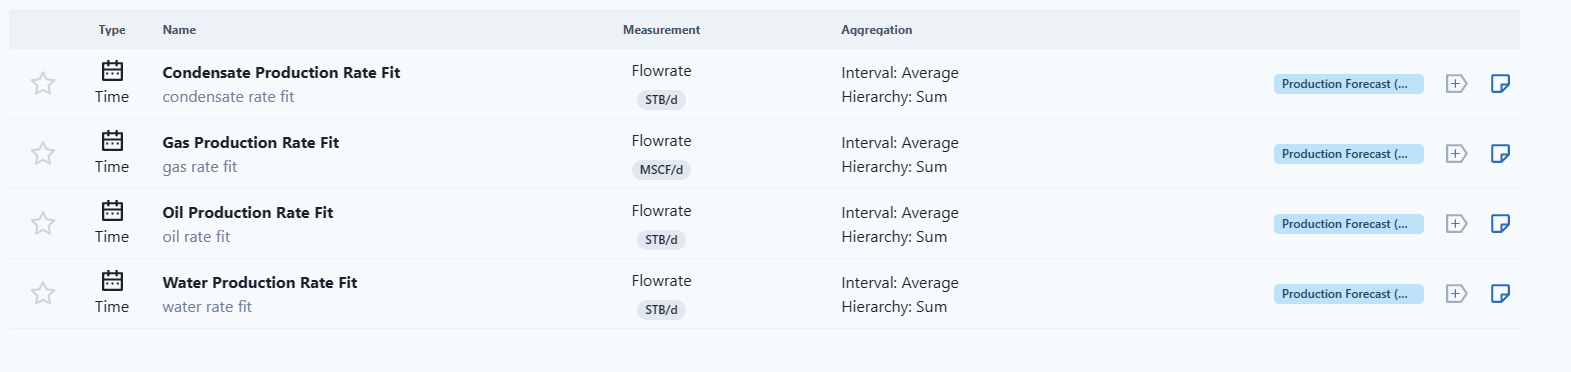
Forecast Signals
- Create several forecast signals
- phase production rate fit
- phase production rate forecast
- produced phase per time increment fit
- produced phase per time increment forecast
- Forecast to either economic limit or 480 months after end of production history, whichever comes first
- Current system limits forecasts to 600 months (50 years)
- The Workspace Value AutoDCAEconomicLimit is a technical limit and should be well below actual economic limits to ensure any subsequent economic calculations (if any) determine the true remaining life of a well

- This can be managed in P# scripting
Secondary Phase Forecasts
- Relies on a-priori determination of the primary phase (oil or gas) for each entity using initial 6-months GOR and rules established by Dr. W.D. McCain (see his PVT textbook)
- Secondary phase forecasts
- Based on primary phase fit and average producing secondary phase ratios from 6-mo period prior to end of history
- Includes oil, gas, water and condensate as applicable
- For entities with gas primary phase: uses OGR, CGR and WGR
- For entities with oil primary phase: uses GOR and WOR
Forecast Management and Clean-up
- Identify offline wells based on date of last production and a user-defined time offset – these wells are not analyzed
- Remove forecasts for newly offline wells
- Completely refresh or replace existing forecast of online wells with each execution of the workflow
- Fit and forecast rates and volumes
- EURs
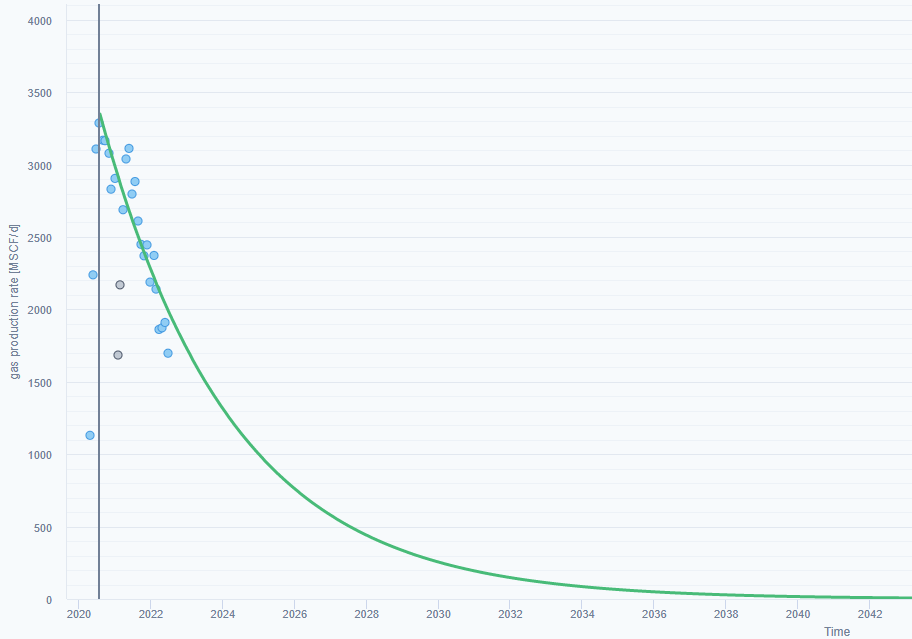
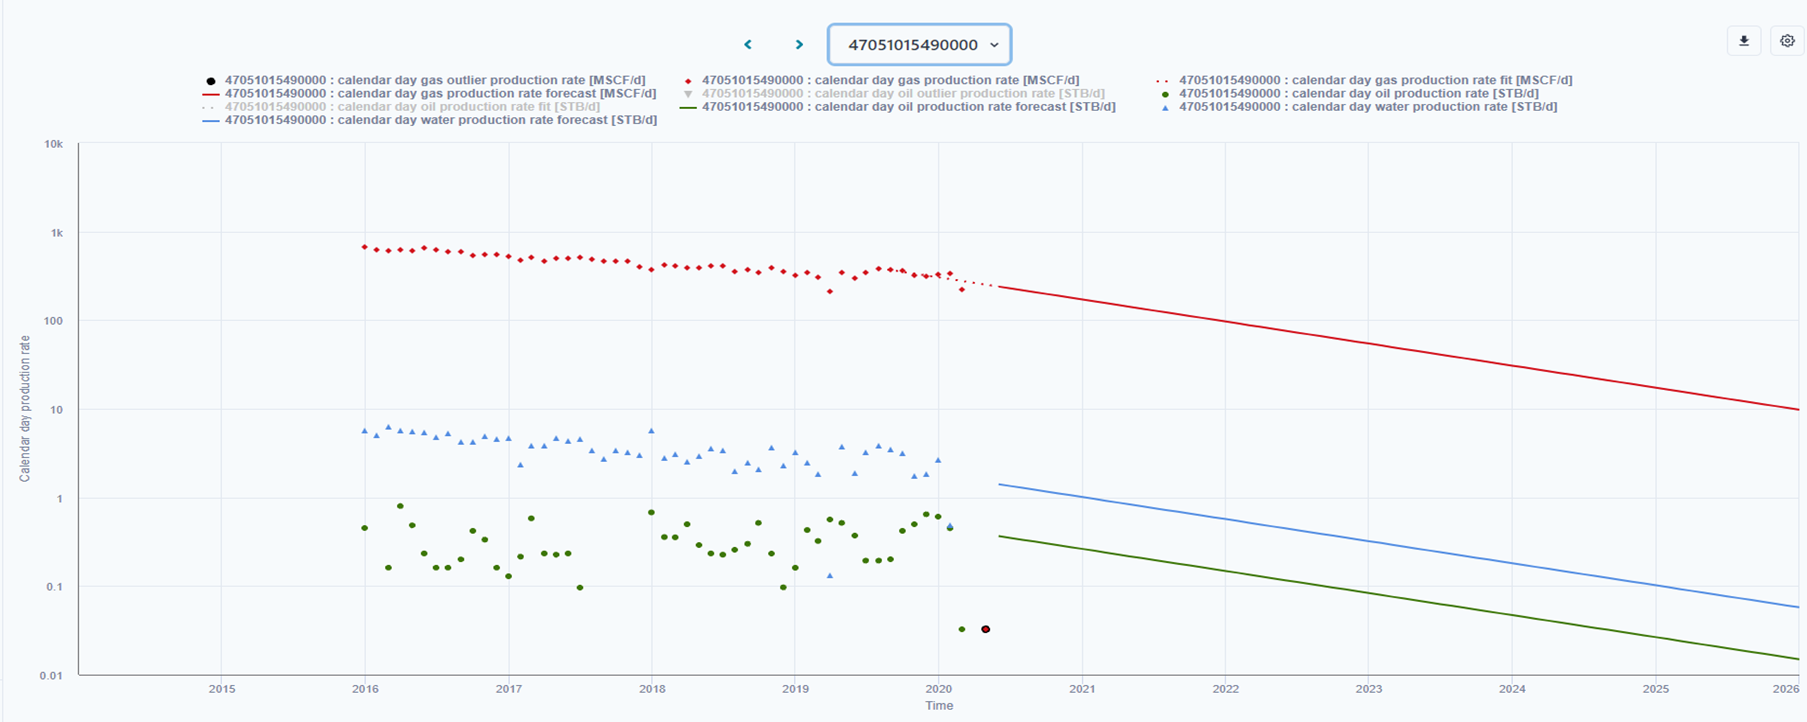
Visualization
Charting
- Semi-log display of complete production history of a production rate signal (rate vs. time)
- Regression window identified
- Outliers identified
- Fitted rates for fitted phases
- Forecast rates for all phases
Example: 3-Parament Fit
Example: 1-Parameter Fit
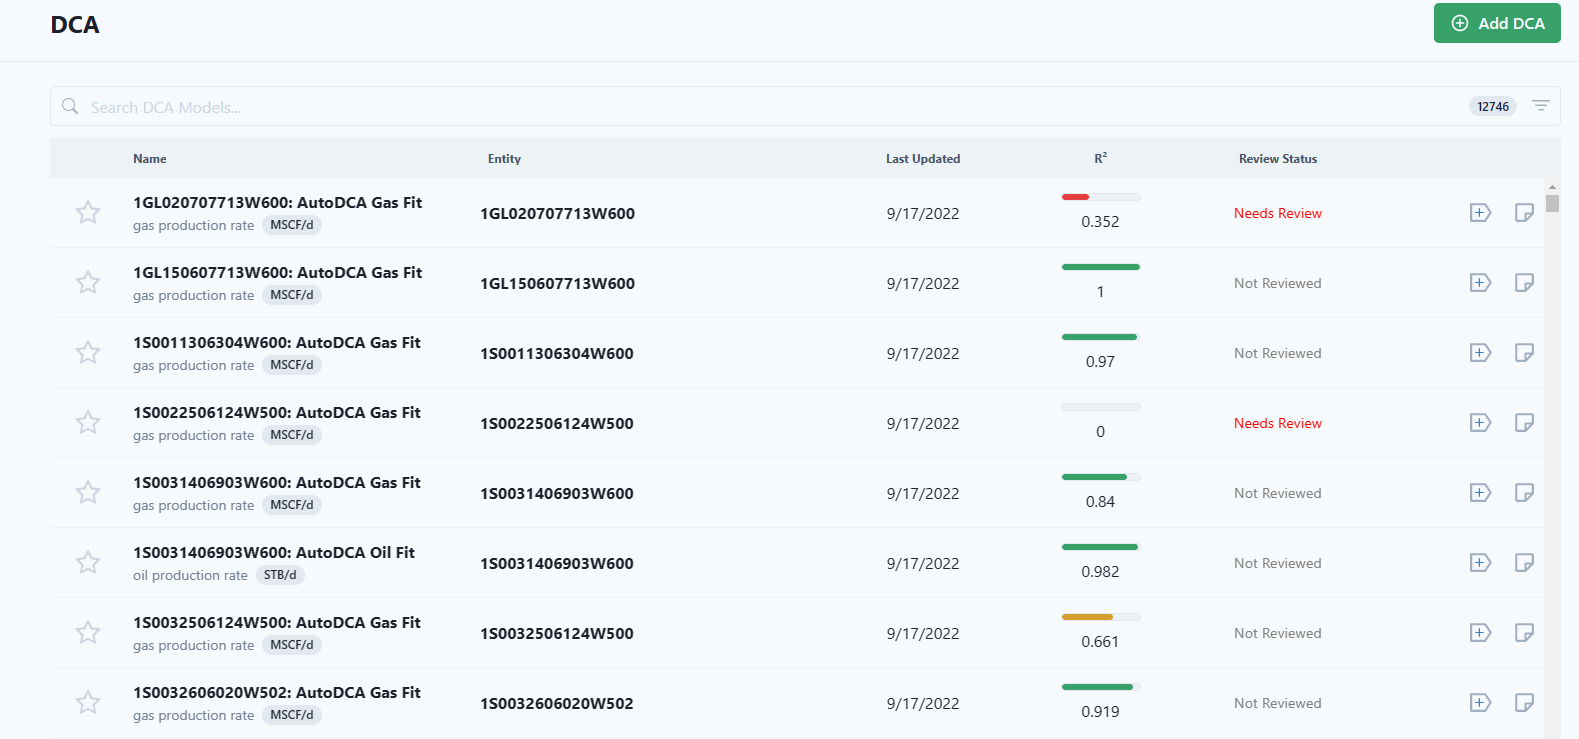
Review Process
- Goals:
- Identify wells that NEED review based on R2
- Quickly review and fix entity’s DCA analysis
- Recalculate downstream information
- Fit and Forecast rate and volume signals
- EUR
- For those wells needing review
- Most common: adjust the start-to-end regression window and refit
- Somewhat common: manually remove outliers and refit
- Less common: manually impose a user-defined set of Q_i,〖 D〗_i, and b-value on the data via visual inspection
- Save resulting model and recalculate downstream information
Production Forecasting Workflow Overview
Question 1: Which wells get a forecast?
- Only “active” wells
- “Active” tag - A non-zero sum of periodic oil, gas, condensate and water production (daily, monthly, etc.)
- Uses Workspace Value AutoDCAOffLineTimeSteps
- Cutoff date for being an “active” well is based on date of last “Active” tag in entire workspace minus the value of AutoDCAOffLineTimeSteps
- Wells that have activity after this cutoff date are considered “active”
- Wells with their last activity prior to the cutoff date are “offline” and will not be evaluated by the Production Forecasting workflow
- P# Script Tag Active Entities Based On Produced Volume sets the “Active” tag for all entities
- Should run after a data load
- “Active” tags would not change unless new production data are added to the database
Question 2: What is the primary producing phase of each well?

- Goes in static string signal primary phase
- Look at cumulative oil and gas production in first 6 months
- Is GOR > 3.3 Mcf/STB? It’s a Gas well
- Is GOR <= 3.3 Mscf/STB? It’s an Oil well
- Also, special cases for Primary Phase
- No production
- Water – if only water production
- Unknown
Primary phase values: Oil, Gas, Water, No Production, Unknown
Relevant P# Scripts
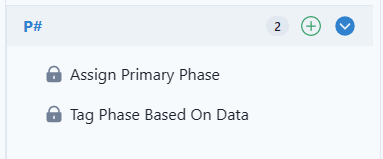
- Assign Primary Phase assigns the static string signal primary phase
- Tag Produced Phases Based On Data assigns phase tags “Oil”, “Gas”, “Condensate” and “Water”
Runs after a data load
- primary phase would not change unless new entities and production data are added to the database
Question 3: What type of regression should I perform on all the candidate wells?
- Goes into reference table Autodca Fit Code
- P# scripts analyze production data to determine what the type of regression should be
- P# script AutoDCA Fit Codes takes care of most of this, and runs at the start of each Production Forecasting workflow to determine the AutoDca Fit Codes for each entity and each phase being fitted
AutoDCA Fit Codes
-7: the rates inside the regression window are less than the Workspace Value threshold MinXXXProductionRate
-6: primary phase is WATER
-5: all the regression data became outliers during the analysis
-3: well has been offline too long; has multiple criteria
-2: there is no production in the database
-1: primary phase is UNKNOWN
0: there was an error during the analysis
1: only 1 month of data; creates a default forecast using Qi=the one-month rate with a default Di, bexp and Dmin
2: less than 6 months and more than 2 months of regression data; creates a 2-parameter fit (Qi, Di) using default bexp and Dmin
3: sufficient data for a 3-parameter (Qi, Di, bexp) fit
4: the DCA model is manually created or adjusted by the user
5: excessive EUR suspected; re-evaluates with a 2-parameter (Qi, Di) fit using a default bexp and Dmin
6: curtailment suspected; creates a default forecast using Qi=rate @ end of history with a default Di, bexp and Dmin
7: Month of max rate is last month; creates a default forecast using Qi=rate @ end of history with a default Di, bexp and Dmin
8: only 2 months of regression data; creates a default forecast using Qi=first rate point, the two available points to derive a Di, and a default bexp and Dmin
Fitting DCA Models
Once all the data staging is complete, the AutoDCA external activity is used on each entity and phase that should get a fit
- The AutoDCA external activity is the regression (fitting) engine
Can fit on primary phase only or all active phases
- Workspace Value AutoDCAPhasesToFit sets this up
- Either “primary” for primary phase fitting only, or a list of phases to fit (e.g., Oil, Gas, Condensate, Water) to fit each phase independently
Production Forecasting Workflow Overview
Question 4: How do I build forecasts?
- Comes after all regression (fitting) analyses are complete
- Uses the fitted DCA model of the fitted phases for each active entity to generate various forecast-related signals
- Computes the secondary phase forecasts from a fixed fluid ratio using the last six months of production
- The end-product is a forecast for each producing phase
Fit and Forecast Signals
Flow Rates
- phase production rate fit
- phase production rate forecast
Volumes
- produced phase per time increment fit
- produced phase per time increment forecast
phase is oil, gas, condensate, water
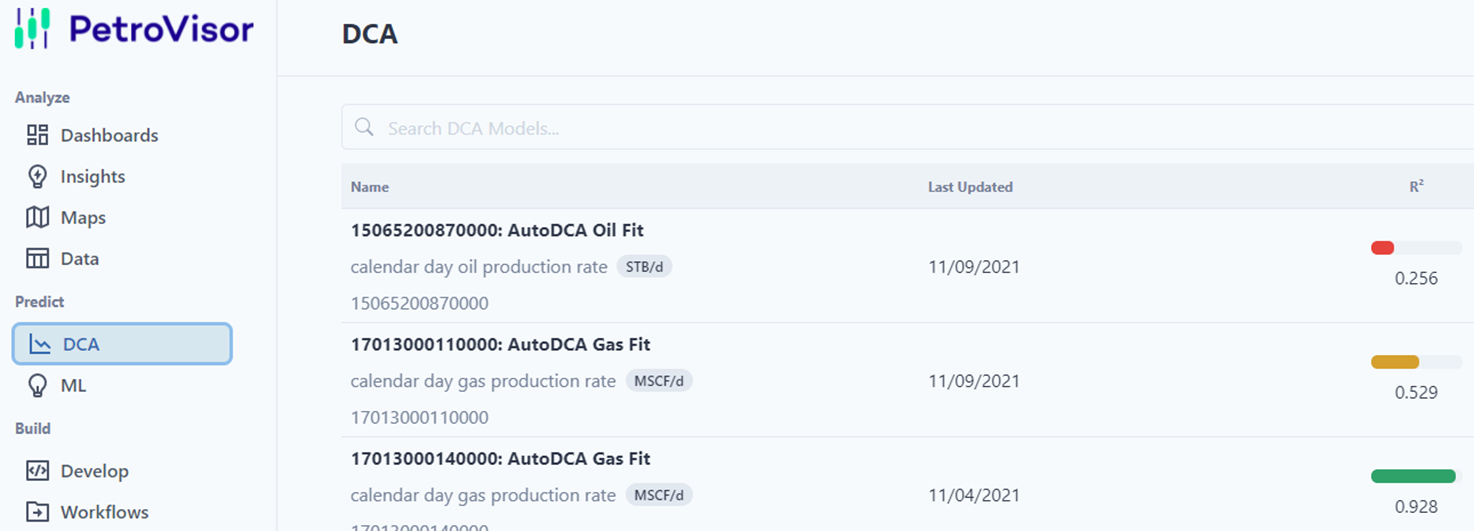
Review Process: DCA Editing Tool
- Where do you find the results of the Production Forecasting workflow?
- Two places to look at and review fits
- DCA editing tool
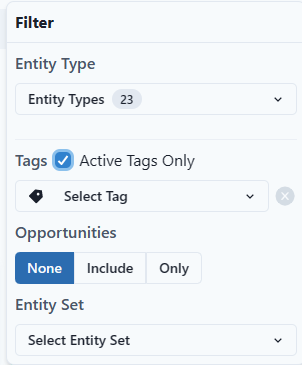
Review Process: Production Forecast Review Filter
- Where do you find the results of the Production Forecasting workflow?
- Two places to look at and review fits
- Data visualization via DCA Review charts

Refreshing Fits you have manually Created or Edited
- If you update a fit in the DCA editing tool, how do you propagate that updated fit into the bigger picture?
- There is a simple, supplementary workflow that achieves this
- Reassigns to the manual fit code
- Refreshes all fit and forecast signals