Objectives of Power User Training

Implement PetroVisor from scratch to determine which wells to divest.

Training Objective

  • Implement PetroVisor using provided data or client specific data.
  • Improve the value of the portfolio.
  • Create a dashboard visualization.

PetroVisor Training Objectives

  • Understand the purpose and deploy Datagration Packages.
  • Create a data connection.
  • Create sources to data base depending on data type.
  • Create scopes to define time for reviewing and integrating data.
  • Integrate data into PetroVisor.
  • Create a hierarchy to understand how different hierarchies can be created for different well sets.
  • Run Workflows to populate signals in PetroVisor.
  • Learn how to use and change Workspace Values (Workspace constants).
  • Run Workflows to establish DCA.
  • Create Pivot Tables in PetroVisor.
  • Create Simple Scripts in PetroVisor.
  • Connect Power BI to PetroVisor to create specific dashboards.
  • Load new Power BI Dashboards into PetroVisor.
  • Create a Workflow to Refresh Power BI Dashboard.

Training Notes

The data is pulled from Enverus if not using client provided data.

Power BI Desktop needs to be downloaded to do this exercise.

Detailed Training Block Objectives

Setting the Stage for the data used in the exercise

  • The objective of this training is to show how to implement PetroVisor from scratch to determine which gas well to divest.
  • This Workspace has the following Packages: Basic, Estimated Ultimate Recovery, Production Forecast (DCA), Production KPIs, Utilities and Voronoi packages. It is all that is necessary for this project. 
  • Training Consists of 28 Lessons.  Each Lesson should take less than 10 minutes to complete.

Lesson

Objectives

Lesson 1: Connect to Training Exercise Data (datagration.com)

    •  Create a connection.
      • Use provided Excel (Haynesville Example)
      • Or to excel using client provided data

Lesson 2: Create a Static Source (datagration.com)

    • Create a Source for Static Text Data
    • Map Data

Lesson 3: Create a Static Numeric Source (datagration.com)

    • Create a Source for Static Numeric Data
    • Map Data

Lesson 4: Create a Numeric Time-Dependent Source (datagration.com)

    • Create a Source for Numeric Time Dependent Data
    • Map Data

Lesson 5: Data Integration of Static Source (datagration.com)

    • Create an integration for Static Data
    • Preview the integration
    • Run the integration

Lesson 6: Create a Scope to Integrate Production Data (datagration.com)

    • Create a monthly scope for production integration.

Lesson 7: Data Integration using a scope for Production (datagration.com)

    • Create an integration for Production with using the monthly scope
    • Preview the integration
    • Run the integration

Lesson 8: Quality Check the Data Integration (datagration.com)

    • Check the Data from the Data Integration

Lesson 9: Create a scope for forecasting data. (datagration.com)

    • Create a scope for Decline Curve Analysis

Lesson 10: Create a Hierarchy (datagration.com)

    • Create a “Well Hierarchy” by creating a root entity and making all wells children of this parent.

Lesson 11: Run the Basic Workflow (datagration.com)

    • Activate the “Basic Monthly Scope” for the four workflows in the Basic Package.
    • Run the “Validate Basic Package” workflow with the integration scope. After this workflow runs, the three other Basic workflows will run one after the other, and will calculate the Cumulatives, Rates, Volumes, and Ratios

Lesson 12: Quality Check the Basic Workflow (datagration.com)

    • Review the Cumulative Gas Production Signal

Lesson 13: Edit the Workspace Value for DCA to only run for 10 years. (datagration.com)

    • Set the AutoDCAForecastMonths workspace value to 120 months, so that the forecast period is 10 years, and not the default of 40 years

Lesson 14: Run the DCA Workflows (datagration.com)

    • Set the status to “Active” for 10 of the 14 DCA workflows that run sequentially, beginning with the Reset workflow.
    • Run the Reset workflow to start the DCA process and track the progress with the Runs tool at the top of the Workflows page.

Lesson 15: Review the DCA (datagration.com)

    • Once the 10 workflows are complete, verify the results by looking at a sampling of the models that should now be on the DCA page.

Lesson 16: Create a Static Data Pivot Table (datagration.com)

    • Create a Pivot Table for the Static Data that includes the static header and location data. Note that a table requires a Table definition, an Entity Set and a Scope. Save and Generate this table and view the results that are saved in the Unified Data Model.

Lesson 17: Load Production and Completion Dashboard (datagration.com)

    • Run the Pivot Table from the Production Summary.

Lesson 18: Create a P# Script called Value Summary (datagration.com)

    • Write (copy) the script from the Code text file to calculate the Value Summary data. Run the script and view the results, which will serve as a temporary “virtual table” in memory. It will not be stored in the Unified Data Model.

Lesson 19: Download Power BI Desktop and Power BI Connector (datagration.com)

    • Install Power BI Desktop on your local computer.
    • Download the PetroVisor connector and place it in the requisite folder.

Lesson 20: Reset Security on Power BI and Restart Power BI (datagration.com)

    • Edit the security settings in Power BI to allow the PetroVisor connector to run.

Lesson 21: Connect to Static Data Pivot Table (datagration.com)

    • Click on Get Data in Power BI and run the PetroVisor connector.
    • Use the PivotTables API Get command to specify the table name and the PetroVisor workspace name to connect Power BI to the first table (Static Data). For example, the syntax for getting the Static Data table from the Power User Training workspace would be PivotTables/Static Data/Power User Training.

Lesson 22: Connect to Production and Completion Summary Pivot Table (datagration.com)

    • Use the PivotTables API Get command to specify the table name and the PetroVisor workspace name to connect Power BI to the first table (Production Summary).

Lesson 23: Connect to Value Summary Script (datagration.com)

    • Do the connection step a third time to connect Power BI to the script that creates the Value Summary temporary table. The example syntax would be PSharpScripts/Value Summary/Power User Training.

Lesson 24: Build a Power BI Dashboard (datagration.com)

  • Create a Power BI report (the .pbix file in your training materials) to your blank report in Power BI Desktop. 

Lesson 25: Upload a dashboard (datagration.com)

  • Once you are satisfied with the formatting, upload the dashboard to your PetroVisor workspace.
  • Verify that the dashboard is visible in PetroVisor and works as expected.

Lesson 26: Build a workflow to refresh a dashboard (datagration.com)

  • Create a workflow in PetroVisor that refreshes the dashboard by running the two tables, one script and the RefreshPowerBIReport external activity.


Setting the Stage Example using Datagration provided data.

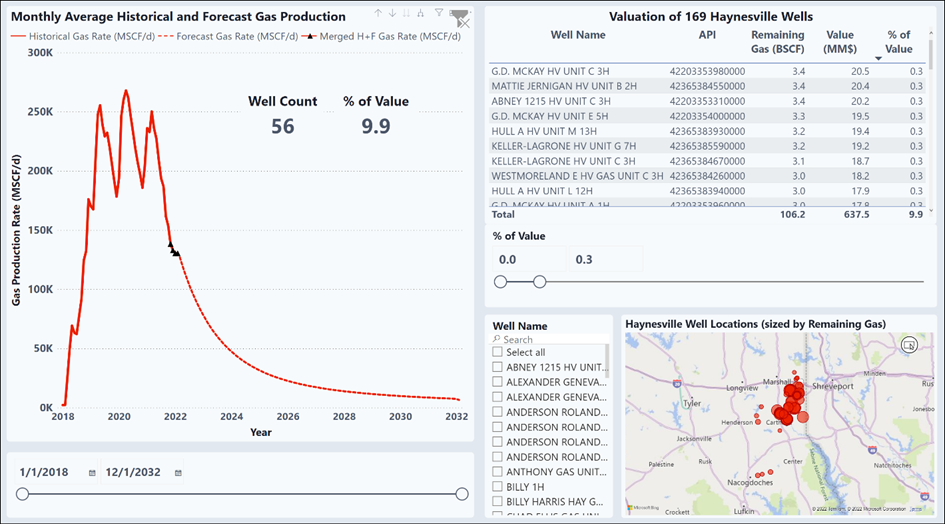
Below is the dashboard visualization that will be developed during the training.  Notice that peak gas occured somewhere in late 2021 and has been declining.  The forecast is based on the PetroVisor DCA tool.  The sum of the remaining gas is in the "Valuation" table.  Wells are ranked best producer to worst producer.  

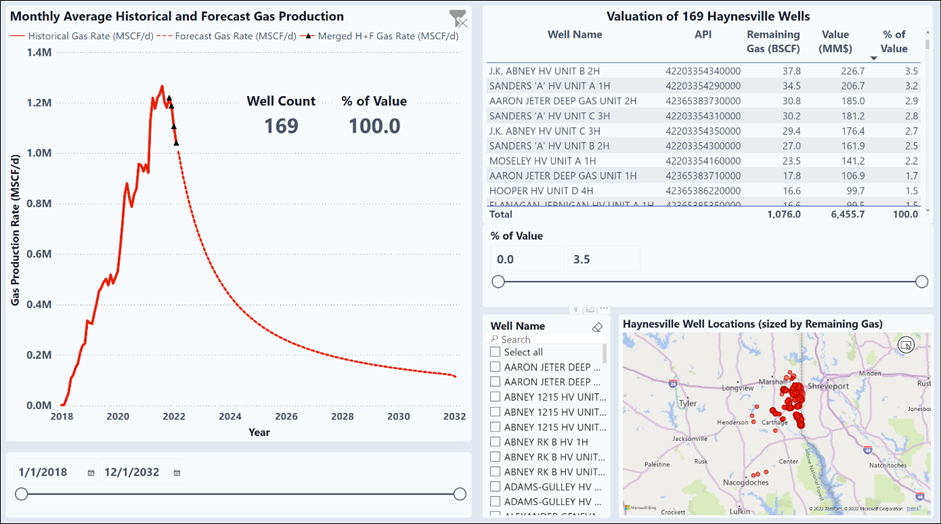
Notes for Valuation Table

Remaining Gas is estimated from summing the DCA.

Value of the remaining gas is estimated by multiplying the by the cost of gas, $6.00 is used in the example.

% of Value is the percent that well makes of the total value of the field.

Clicking on a well in the table will highlight the well on the map and filter the DCA.


The 56 Lowest-Performing Wells Represent 10% of the Total Value ($638 Million)

Notice the chart below is sorted to the lowest 10% wells.    These wells might represent a set of wells that might be to divest.