- Datagration Knowledge Base
- Customer Training
- Power User Training Exercise
-
Getting Started
-
Customer Training
-
Customer Success
-
Updates
-
Production Optimization
-
Artificial Lift Optimization
-
Completion Optimization
-
Environmental, Social & Governance
-
Development, Acquisition & Divestitures
-
Enhanced Oil Recovery
-
Admin
-
P#
- Getting Started with P#
- Data Cleansing
- String Functions
- Scenario Functions
- Regression Functions
- Placeholder Functions
- Neighborhood Functions
- Mathematical Functions
- Logic Functions
- Entities Function
- Moving Window Functions
- Time and Date Functions
- Statistical Functions
- Economic Functions
- Data Handling
- Additional Functions
- Directional Functions
- Machine Learning Functions
- DCA Functions
-
Packages
Lesson 16: Create a Static Data Pivot Table
Create a Pivot Table for the Static Data that includes the static header and location data. Note that a table requires a Table definition, an Entity Set and a Scope. Save and Generate this table and view the results.
Static Data Table
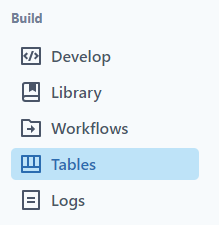
Navigate to Tables.

Click Add Table.

Use the expression builder to build a table.
Click Expression.

In this example, we need the following Columns.
- well name
- wellbore profile
- formation
- surface latitude
- surface longitude
Select the first column by using the Signal drop-down menu.

Click Add Expression to add the column.
![]()
Continue adding columns until it looks like the Table below.

Select the Entity Set.

For this example, we are going to load the All-Wells Entity Set.
Select Load
Choose All Wells.

Notice after selecting it populates the Entity Set at the bottom with a list of entities and map. It has the 169 wells brought into this workspace.


Next, load the Scope.

Load the scope Start to End Monthly.

Notice it populates the start of the data load out to the forecast.

Name the table Static Data Set.

Select Save to create the pivot table.

Select Save & Generate to be able to view the table.

To view, select View Saved.


Click out of the pop-up screen.
