-
Getting Started
-
Customer Training
-
Customer Success
-
Updates
-
Production Optimization
-
Artificial Lift Optimization
-
Completion Optimization
-
Environmental, Social & Governance
-
Development, Acquisition & Divestitures
-
Enhanced Oil Recovery
-
Admin
-
P#
- Getting Started with P#
- Data Cleansing
- String Functions
- Scenario Functions
- Regression Functions
- Placeholder Functions
- Neighborhood Functions
- Mathematical Functions
- Logic Functions
- Entities Function
- Moving Window Functions
- Time and Date Functions
- Statistical Functions
- Economic Functions
- Data Handling
- Additional Functions
- Directional Functions
- Machine Learning Functions
- DCA Functions
-
Packages
Map Layers
PetroVisor Map Layers are features that can be on a map. Things like Voronoi Well Diagrams, ESG production, production facilities, pipelines are all considered layers.
PetroVisor works with Mapbox.
Once the desired "layer" is created, it's easy to load into PetroVisor.
There are two ways to create a layer.
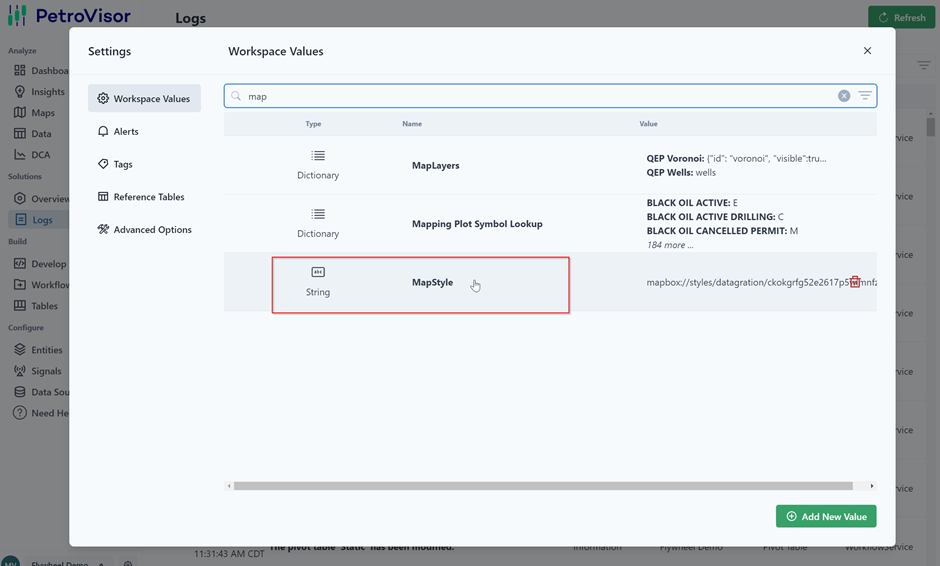
Settings
In PetroVisor Workspace, select Settings 
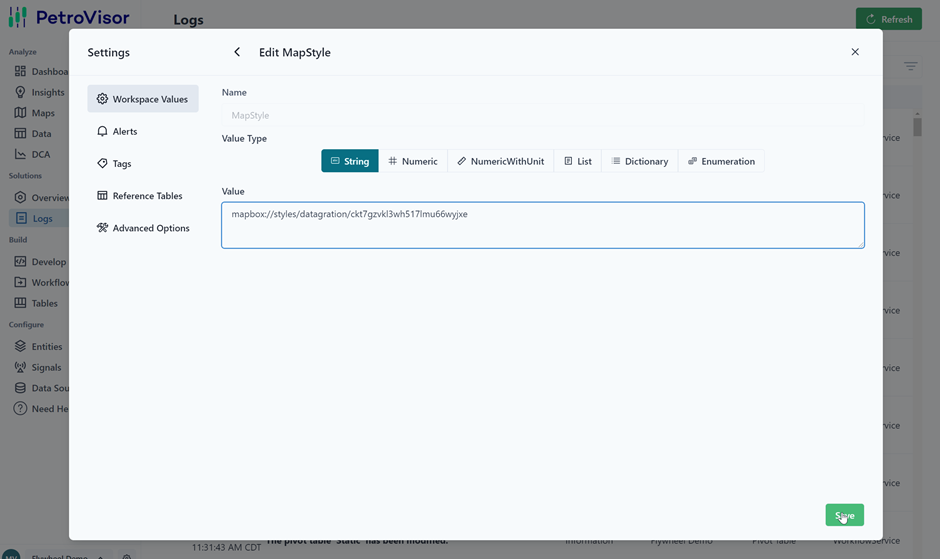
and select MapStyle.

Paste link to desired layer and hit save.

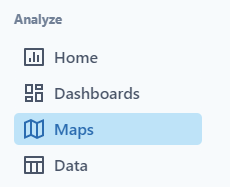
In Map under Settings
Navigate to Maps in the Navigation Panel.

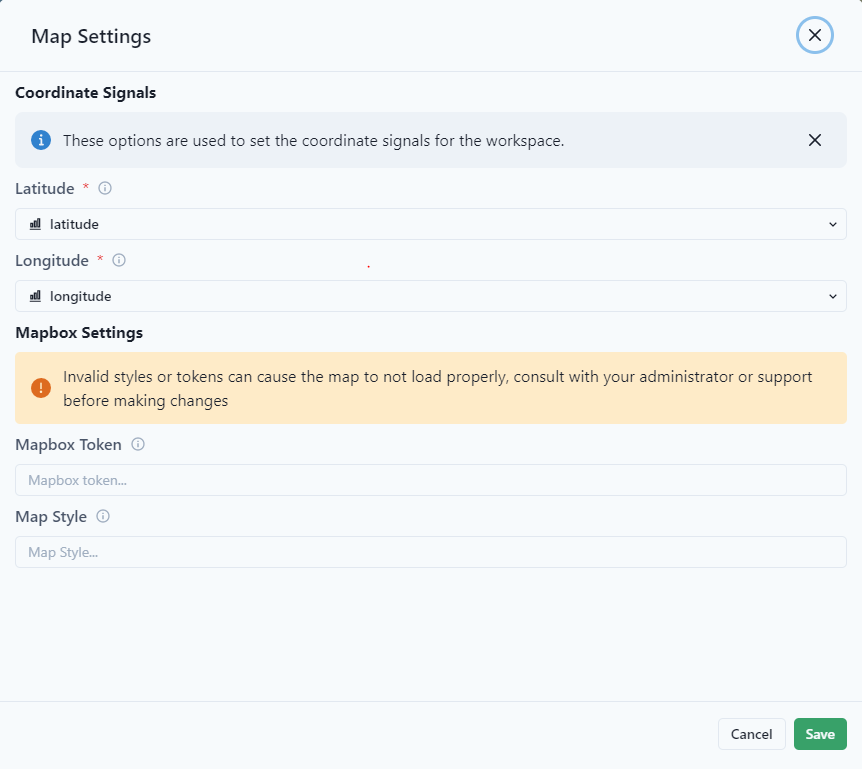
Select the settings on the map key.
Enter your Mapbox Token and Map Style.

Select Save.

