-
Getting Started
-
Customer Training
-
Customer Success
-
Updates
-
Production Optimization
-
Completion Optimization
-
Environmental, Social & Governance
-
Development, Acquisition & Divestitures
-
Enhanced Oil Recovery
-
Admin
-
P#
- Getting Started with P#
- Data Cleansing
- String Functions
- Scenario Functions
- Regression Functions
- Placeholder Functions
- Neighborhood Functions
- Mathematical Functions
- Logic Functions
- Entities Function
- Moving Window Functions
- Time and Date Functions
- Statistical Functions
- Economic Functions
- Data Handling
- Additional Functions
- Directional Functions
- Machine Learning Functions
- DCA Functions
-
Packages
How can I change settings and export on the Script results?
Users can easily change settings and export the information on both the Stat and Chart Tab.
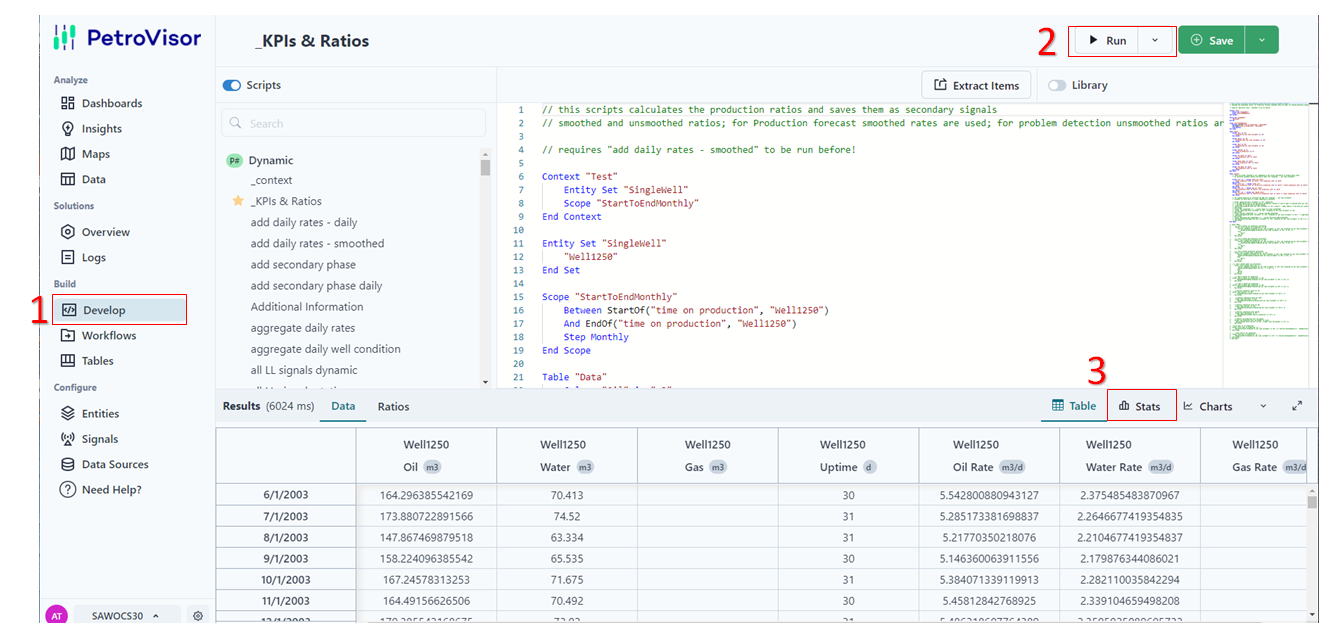
Navigate to the Stat tab.

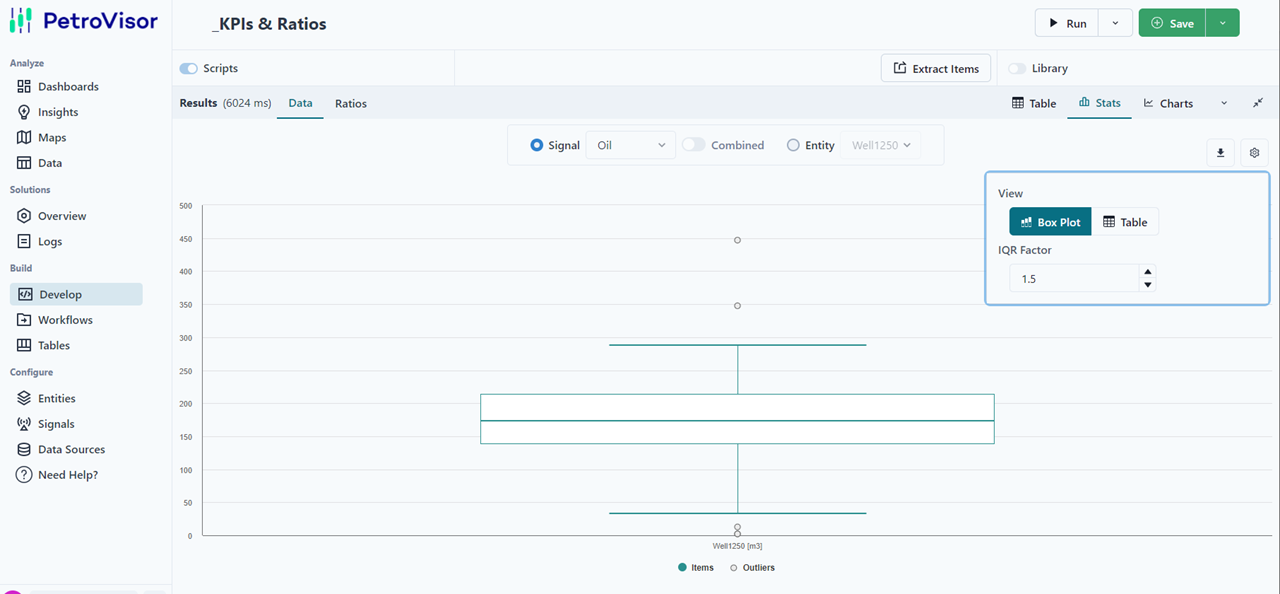
The Settings tool will pull up the settings that can be changed. The data can be viewed as a "Bar Plot" or a "Table." The IQR Factor is set to 1.5, which can be changed.

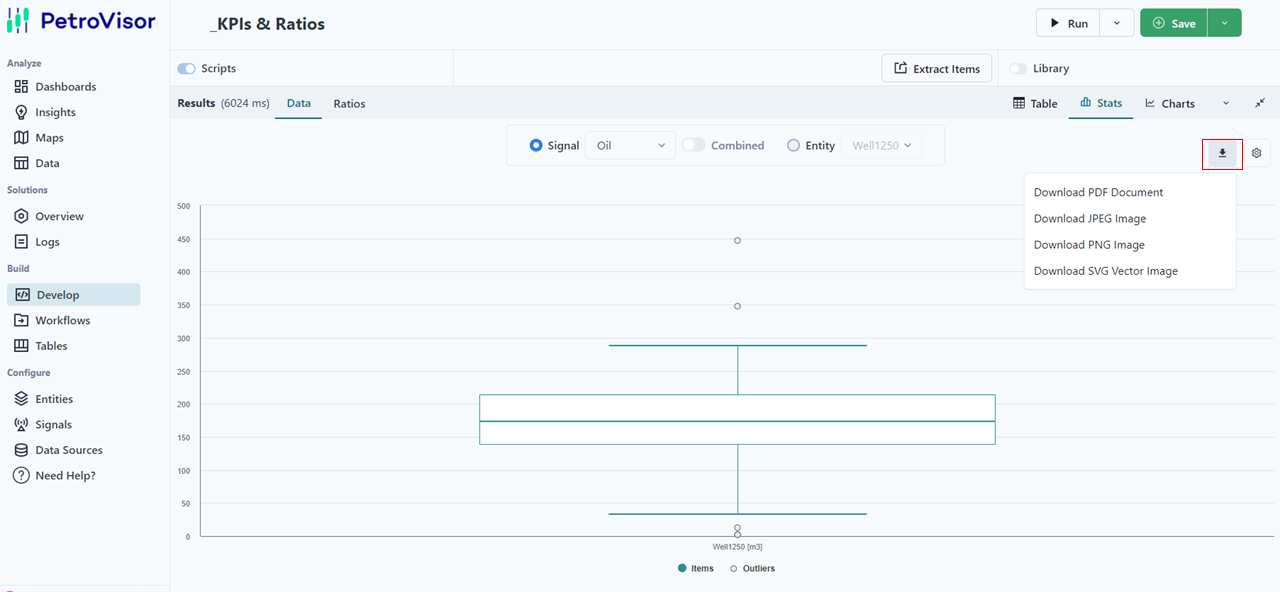
The export feature is next to the settings feature. Images can be exported as PDF, JPEG, PNG, and SVG Vector.

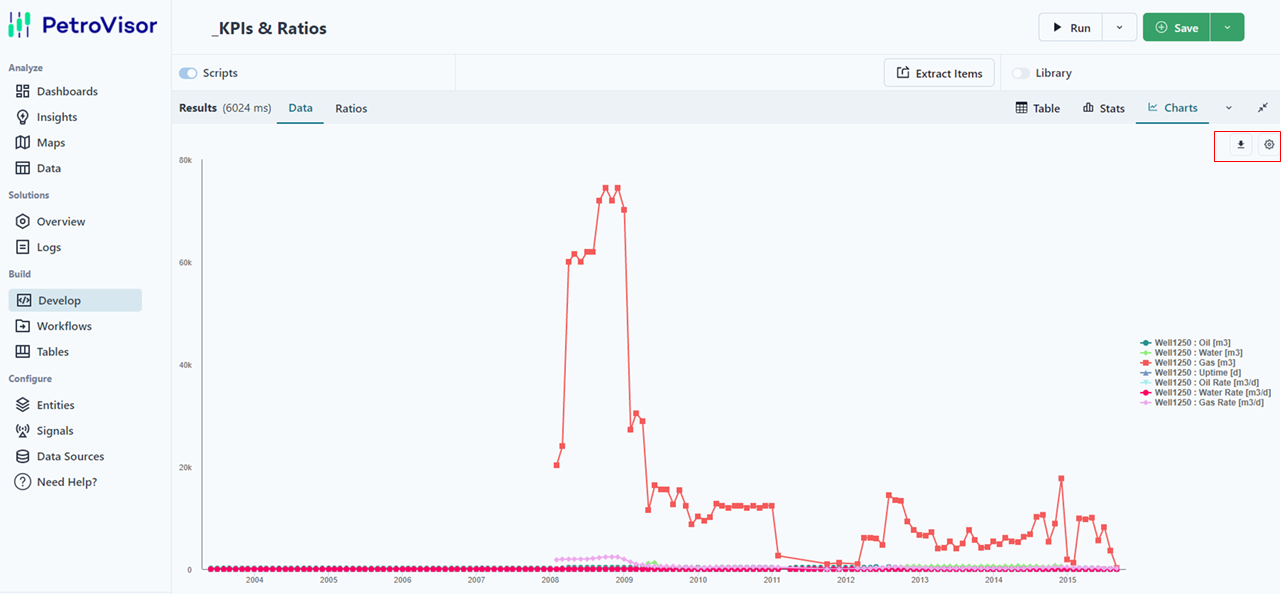
Settings and Export are also Available on the Chart Tab.

