This dashboard gives a unified view of production, operations, and finance in a single view.
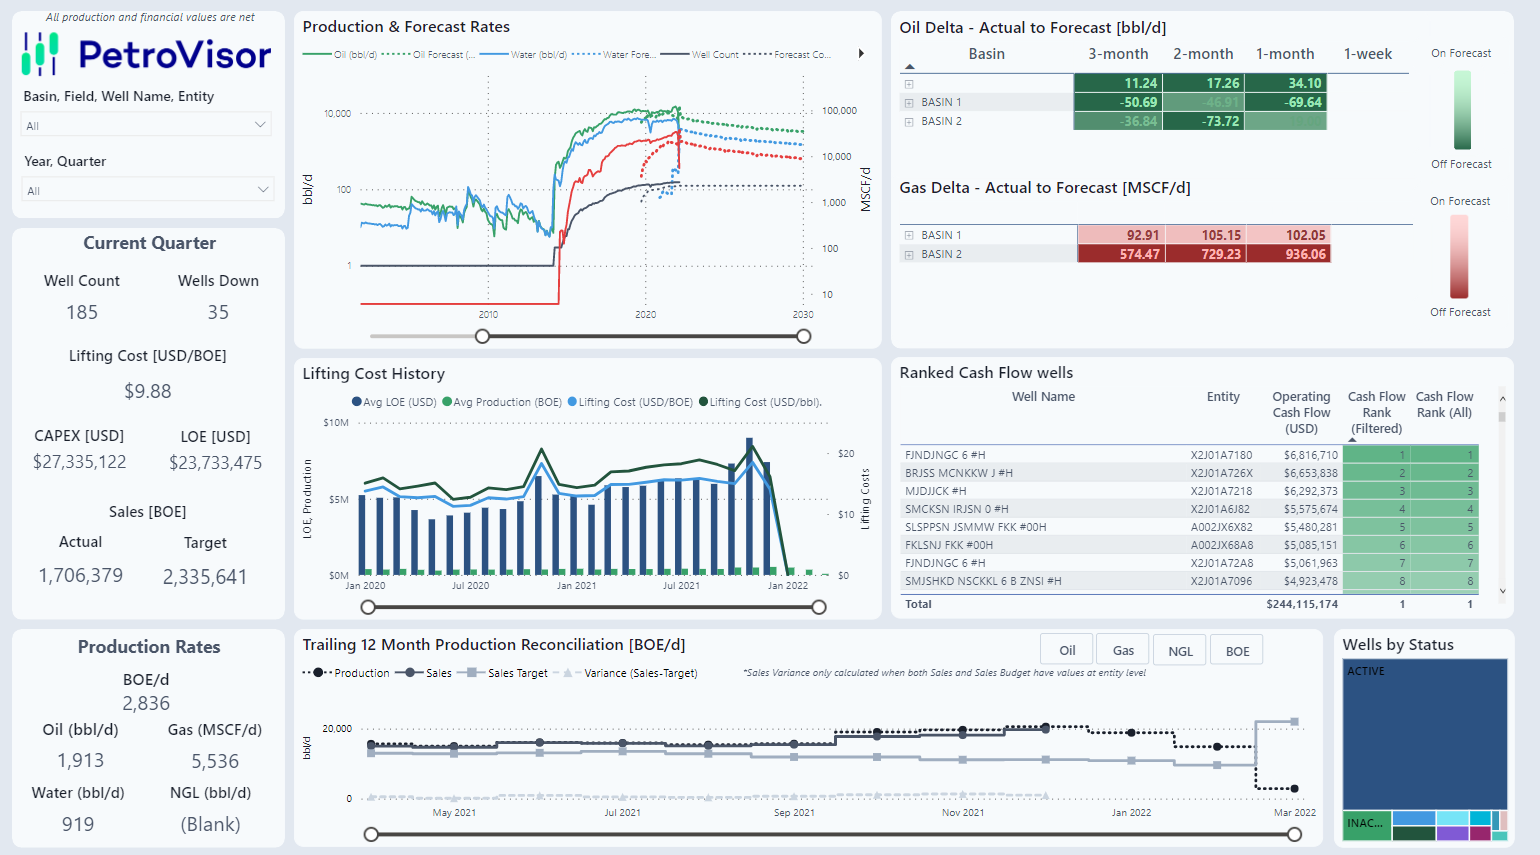
The Company Performance Dashboard has four (4) main tabs.
- Home Page - Overview of key metrics
- Finance - An in-depth analysis of financial data
- Production - An in-depth analysis of production data
- Tables - Aggregation of data in a table view
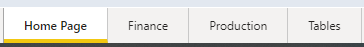
Home Page
The Company Performance Dashboard Home Page is a quick view of production and financial data. This view will give an indication of performance across all areas of business.
The filter on the left will change the view to be specific to Entity or time period.
The information displayed on under the filter is consistent across all the tabs in this dashboard. The quarter information is for the current quarter.
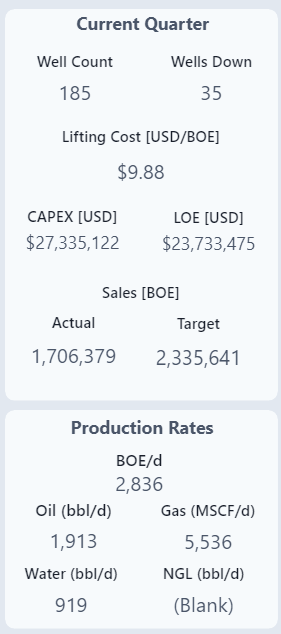
For the current quarter
- Well Count is the current number of wells producing
- Wells down are the wells not producing
- Lifting Cost is the average lifting cost
- CAPEX Cost
- LOE - Lease operating expenditures
- Sales - actual vs target
- Production Rates
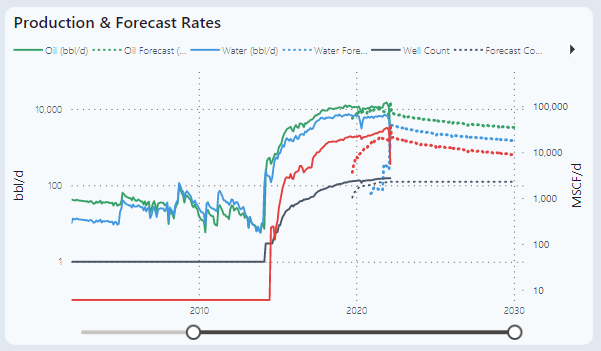
The Production & Forecast Rates
The production data comes from the client production data. The forecast can be pulled from either the client's analysis or from Datagration Decline Curve Analysis. The time slicer at the bottom can filter to a specific time period.
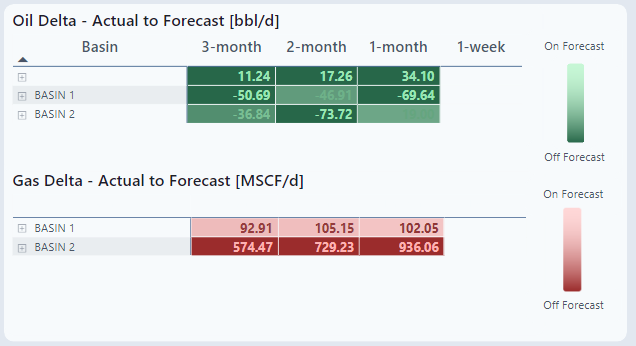
Oil Delta & Gas Delta
These charts compare actual to forecast. The darker the number pulls attention to business units more off forecast.
- 3-month is the average of the last 3 months.
- 2-month is the average of the last 2 months.
- 1-month is the average of the last month.
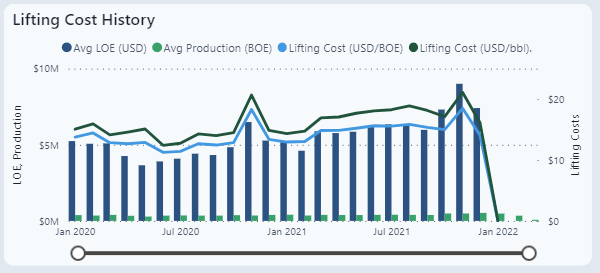
Lifting Cost History
These are well specific costs are pulled from client data sources. Lifting costs could be from the client system or calculated.
Datagration calculation:
- where BOE = (STB Oil) + (Mcf Gas)/6 and
- Mcfe = (Mcf Gas) + (STB Oil)*6
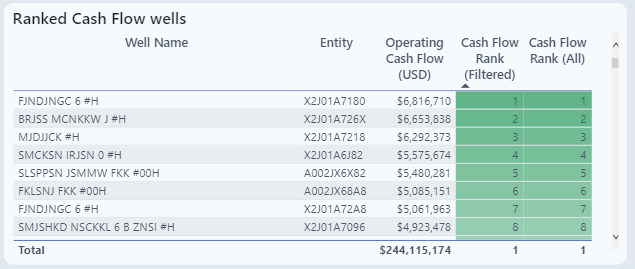
Ranked Cash Flow Wells
Individual well with the overall value. Notice that if the filter is applied to the dashboard, the Cash Flow Rank (Filtered) will compare only the wells filtered.
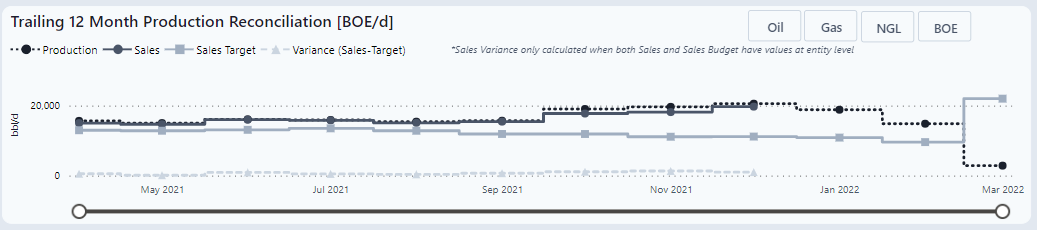
Trailing 12 Month Production Reconciliation
This chart compares actual production, actual sales vs. targets.
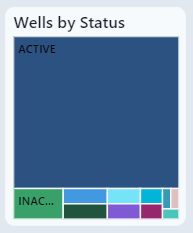
Wells by Status
Status is pulled from client data. This chart is on all tabs.
Finance
Granular view of cash flow, CAPEX and OPEX.
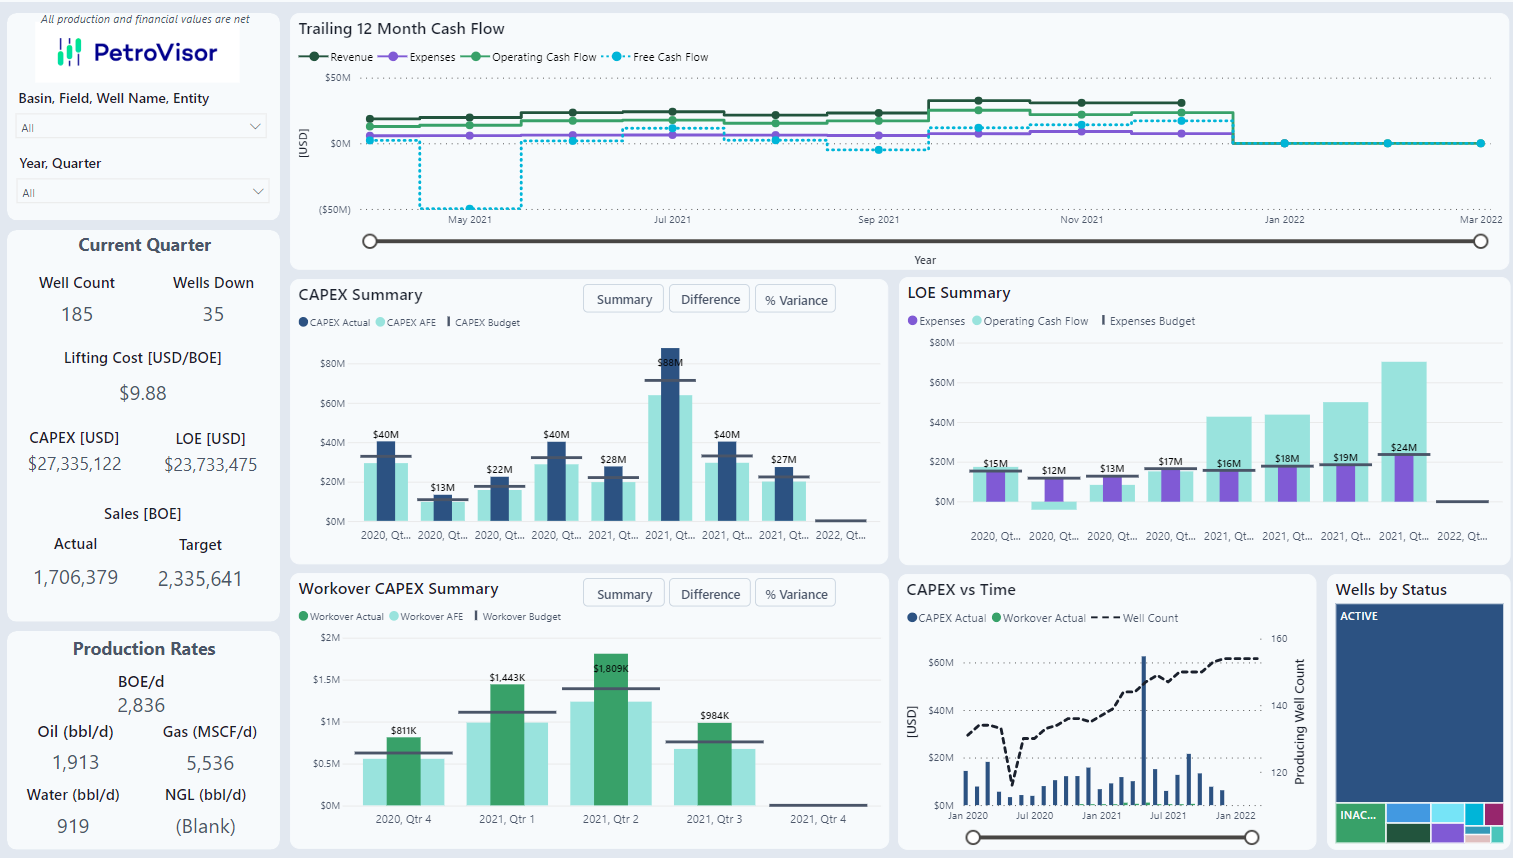
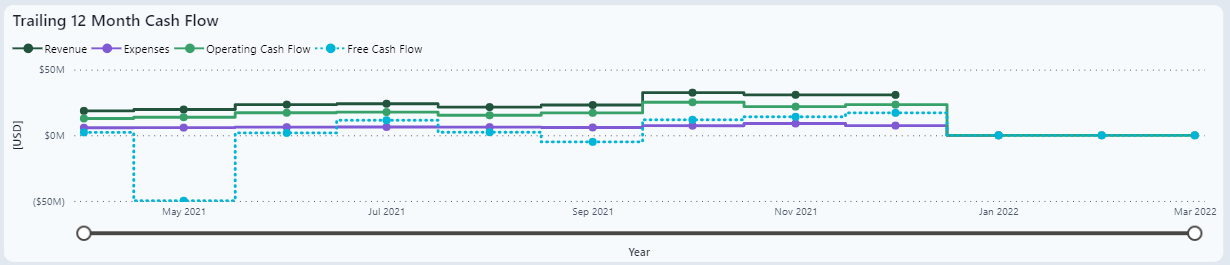
Trailing 12 Month Cash Flow
Cash flow comparing revenue vs expenses over time. This data is from client accounting systems.
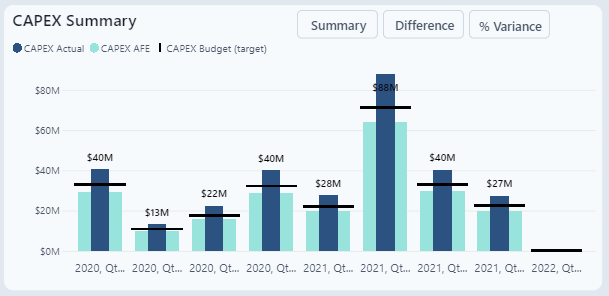
CAPEX Summary
Summary chart that displays actual, AFE and budget. The tabs at the top right allow a user to look at summary, difference or variance data.
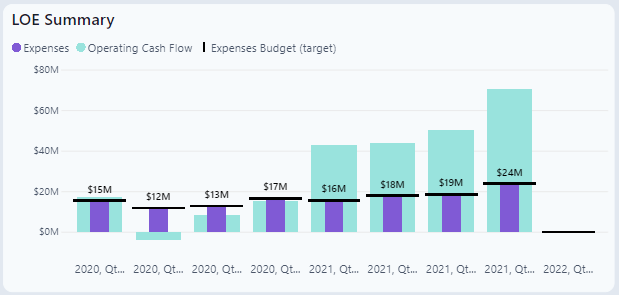
LOE Summary
The Lease Operating Expense displays expenses, cash flow, and budget.
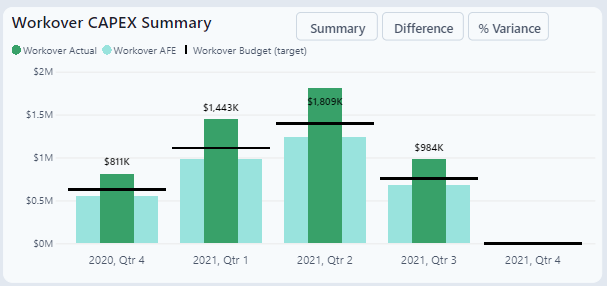
Workover CAPEX Summary
More detailed information on CAPEX spent on workovers.
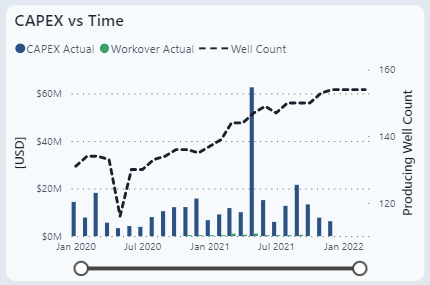
CAPEX vs Time
This chart displays CAPEX over time.
Production
Granular view by well.
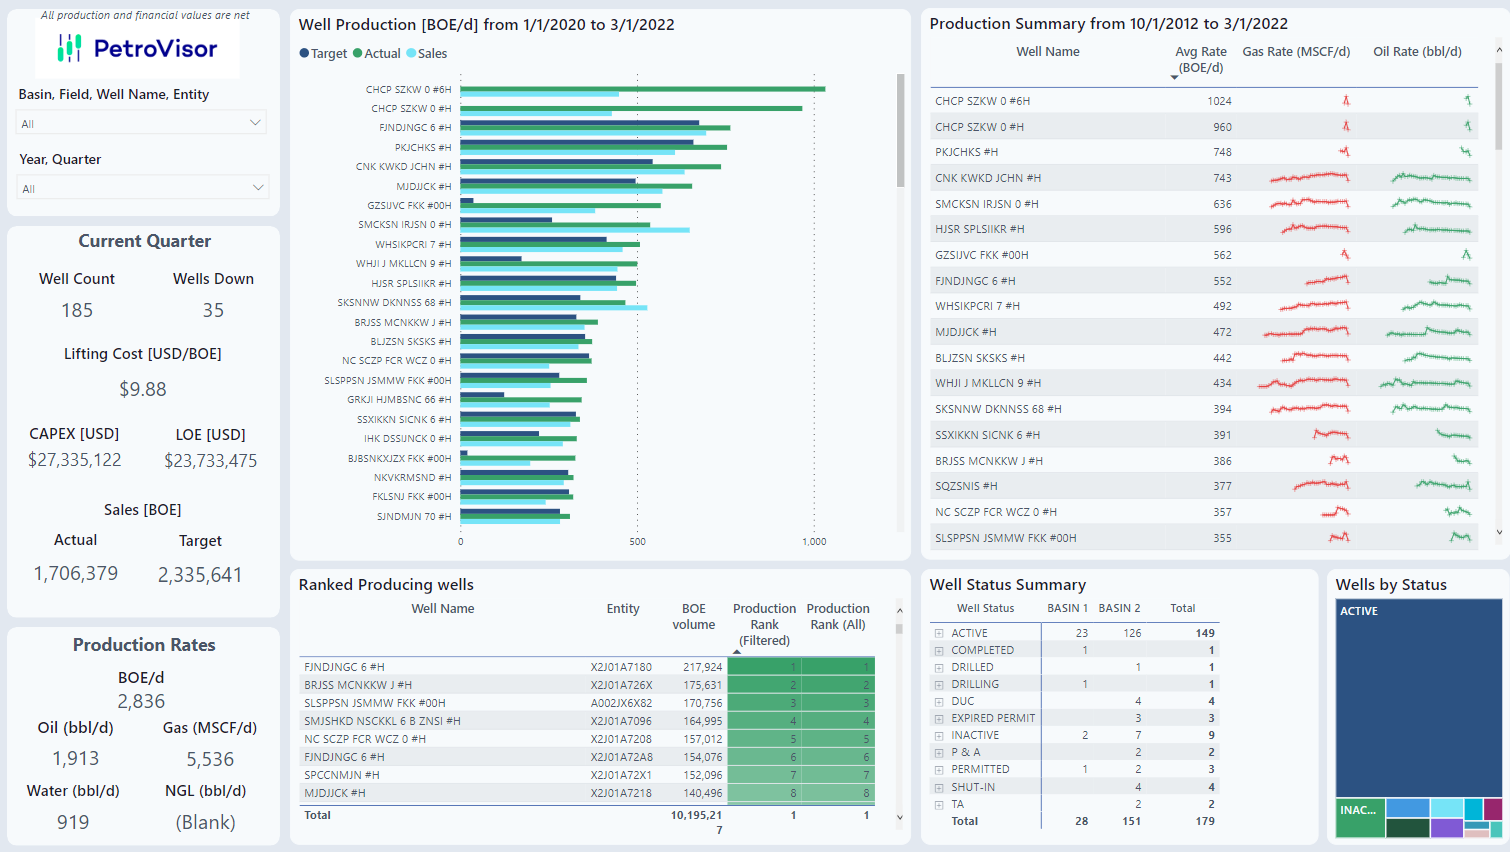
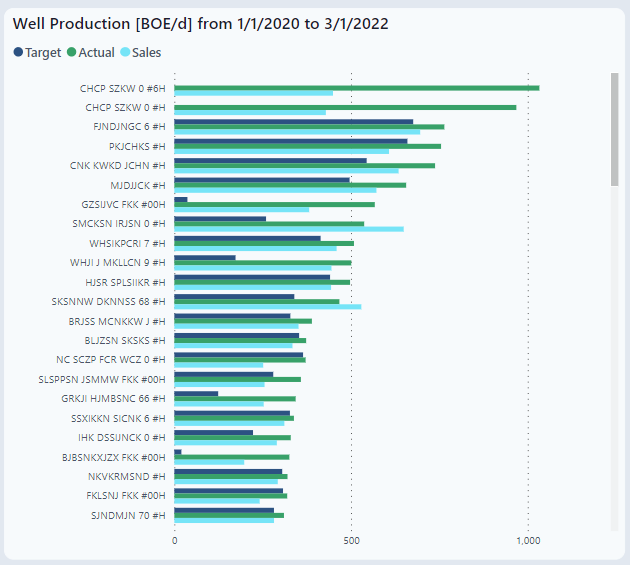
Well Production
Production listed by well level ranked by Actual. Wells listed in this chart must have values.
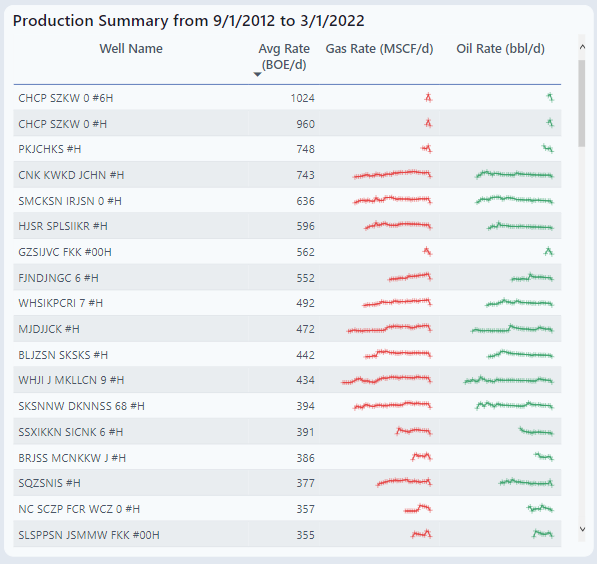
Production Summary
Well level production trends from the data shown in the name.
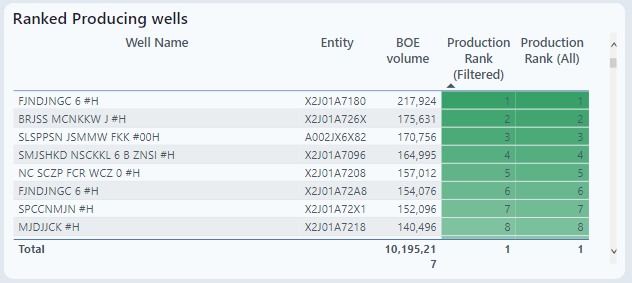
Ranked Producing Wells
Filter by wells showing the wells ranked by production volume.
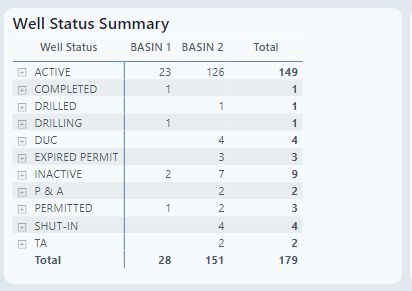
Well Status Summary
Lists well by status from the source system.
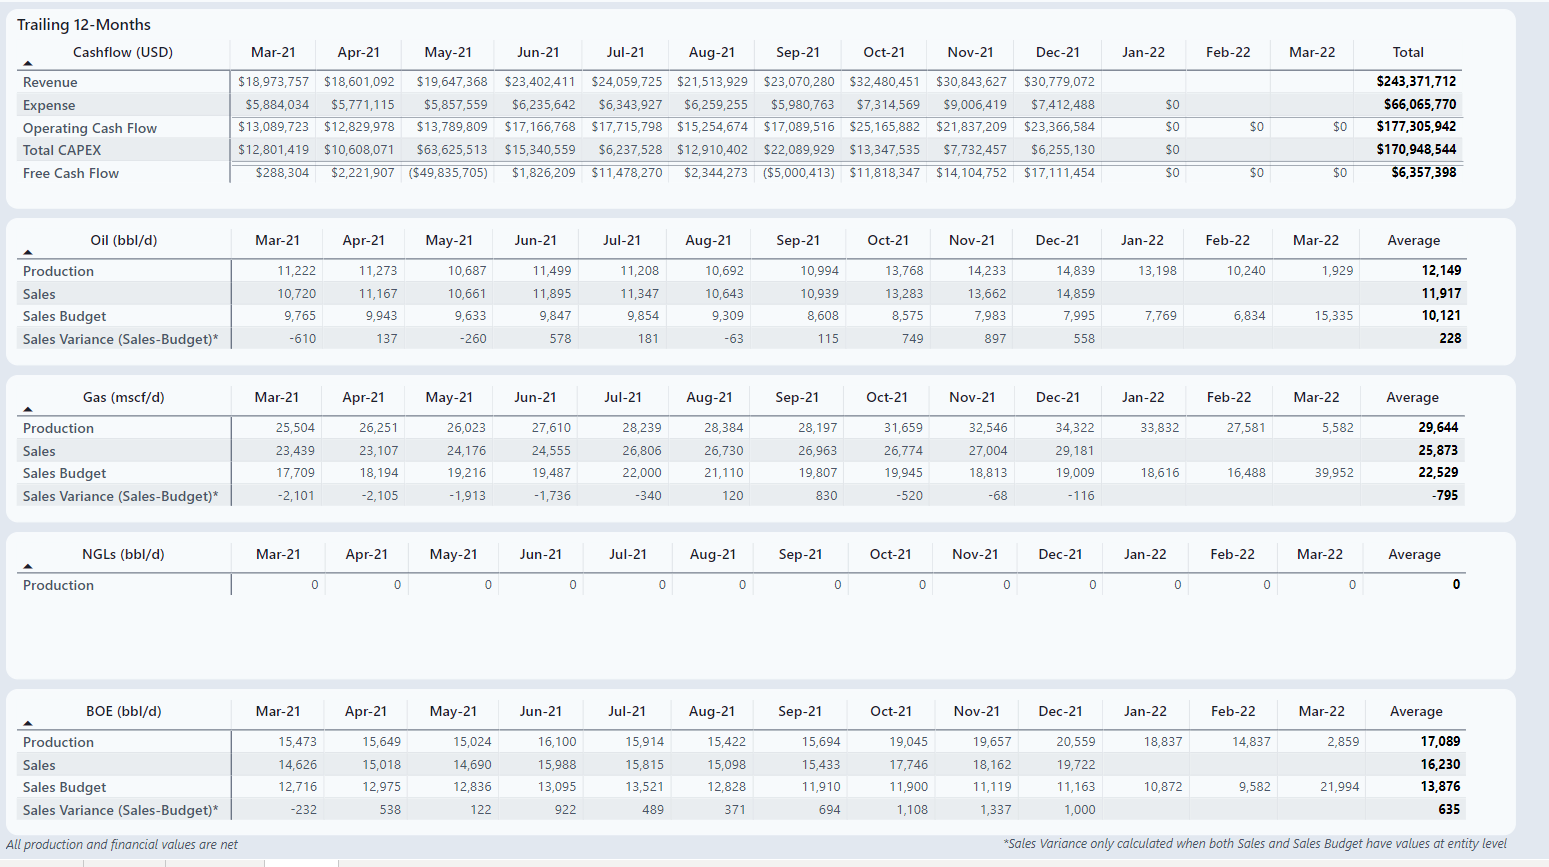
Tables
The tables tab lists summarized views across finance and production.